 The data analysis course professor tended to focus on the practical application of statistics.
Avoiding statistical theory was fine with me. Learning statistics for me was on how to solve problems, optimize designs, and understanding data.
Then one lecture started with the question, “Why do we sum squares regression analysis, ANOVA calculations, and with other statistical methods?” He paused waiting for one us to answer.
We didn’t. I feared the upcoming lecture would include arcane derivations and burdensome theoretical annotations. It didn’t.
The Variance Formula
You may have noticed the population parameter that describes the spread of the data, the variance, is squared. It is the second moment of the data, as the skewness is the third moment. I digress.
The lecture on why we sum squares had to do with the numerator of the variance formula.
After determining the center of mass of a dataset, the mean, statisticians wanted to have a convenient way to describe the spread of the data. The spread of the data could be described by the range, the maximum value minus the minimum value, yet that wasn’t very description of the sparseness or denseness of the dataset.
One idea was to calculate the distance from one data point to the next from the minimum value to the next least value. I do not recall why that didn’t catch on.
Another idea was to determine the distance of each data point to the origin, or zero. If you try this idea you quickly see that it has the mean value built into the result. Datasets centered at zero would result is smaller calculated results than datasets centered far away from zero.
Ah ha! Let’s use the mean of the dataset instead of zero. That way the resulting set of distances are as if centered at zero. Normalized is what some call this process.
So, give it a try:
- Find or create a small set of measurements
- Determine the dataset’s mean
- Subtract the mean from every datapoint
- Sum the differences
Wait a minute, the result is close to zero. Looking at your data, some differences are positive and some negative. If you started with a symmetrical dataset, half will be above zero and half below. The sum of the differences will always be near zero.
One way to solve this is to use the absolute value of the differences. That might work and once again I suspect the lecture drifted too deep into the theory end of statistics.
Another way to remove negative values is to square them. Squaring a negative number removes the negative sign every time. Cool. Yet now the differences are much larger than the actual differences. The units are squared, too. No worries, we can use the positive square root of the result to define standard deviation.
Thus we square the differences between the individual values and the mean to avoid the sum being zero all the time.
The story the professor told is not likely the way the formula for variance came about way back when. It was entertaining and 30+ years later I do fondly recall that lecture.
Regression Analysis and Errors
The need to navigate the open seas lead to the development of the least squares method for regression analysis. The sailors needed the capability to interpret the location of stars to their location on the surface of the earth.
In 1805 Legendre published New Methods for the Determination of the Orbits of Comets. [Actually published in French, Legendre, Adrien-Marie (1805), Nouvelles méthodes pour la détermination des orbites des comètes]. Within the discussion, he described the least squares method for determining regression parameters. This method significantly improved navigation, too.
The concept involved finding the line which minimized the distance between the line and each data point. Like the variance calculation, squaring the differences provided a meaningful result.
Note: Carl Friedrich Gauss (yes, that Gauss) published work in 1809 describing the least squares method and expanding it to include elements of the normal distribution, naturally. Robert Adrain also published his independent work on the same method in 1808.
The time was right for the development of the least squares method. For more about the development of least squares method for regression analysis see Aldrich, J. (1998). “Doing Least Squares: Perspectives from Gauss and Yule”. International Statistical Review. 66 (1): 61–81.
ANOVA and Sum of Squares
ANOVA uses the sum of squares concept as well. Let’s start by looking at the formula for sample variance,
The numerator is the sum of squares of deviations from the mean. The numerator is also called the corrected sum of squares, shortened as TSS or SS(Total). Meanwhile, we call the denominator the degrees of freedom.
Now do a bit of algebra and write sample variance as
There are two terms in the numerator, the first is called the raw sum of squares. The second term is called the correction term for the mean.
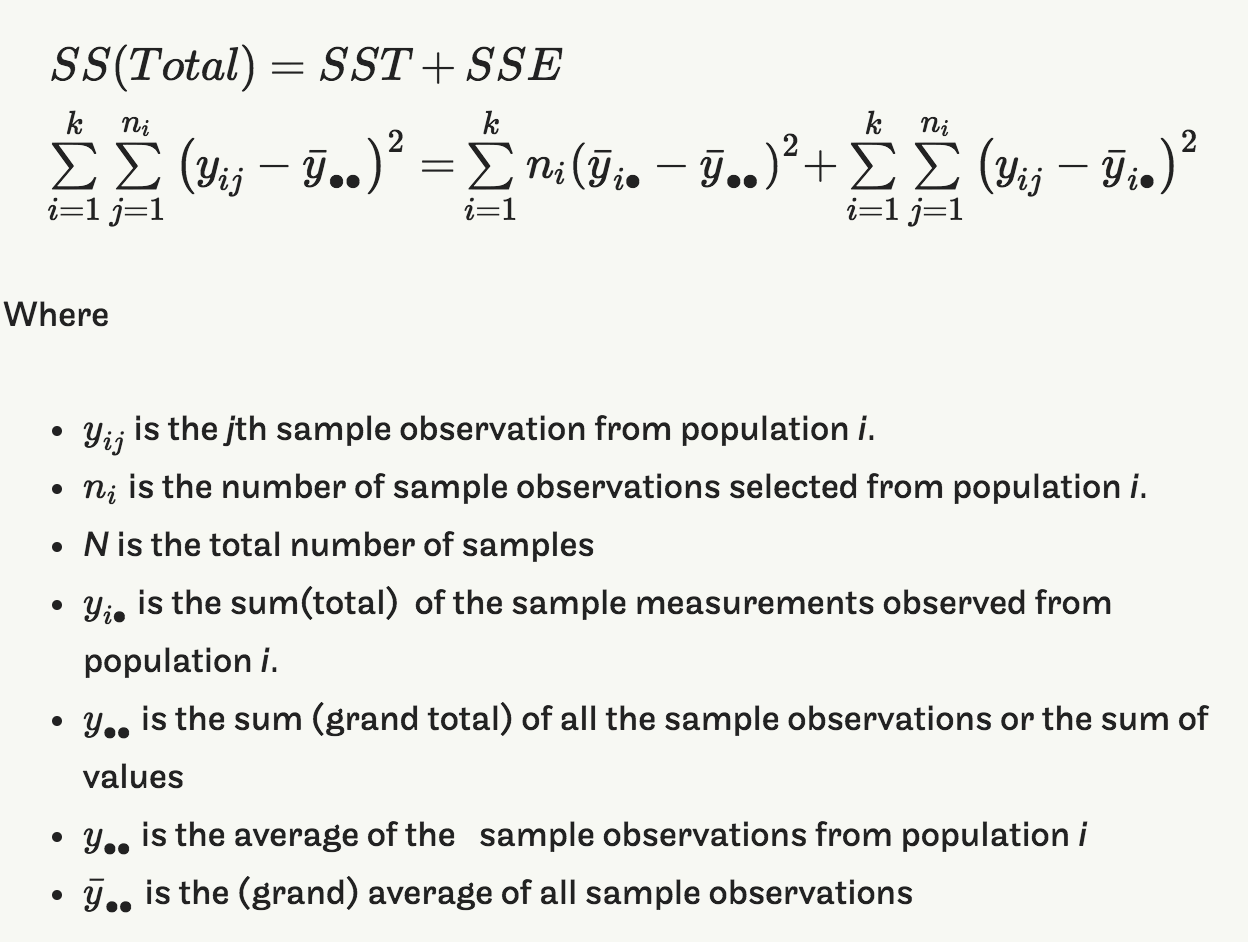
In a one-way ANOVA we are interested in effect of each treatment. We can separate the variance contributed by each treatment along with the unaccounted for deviations (a source of variation we often attribute to error). Using only the numerator, the Corrected Sum of Squares, we then separate the contribution of the variance into separate terms.
Summary
A memorable lecture, a bit of history, and plenty of squaring differences. Hopefully, this provides a little context and helps you understand the use of sum of squares in the various statistical processes you use on a regular basis.
Bio:
Fred Schenkelberg is an experienced reliability engineering and management consultant with his firm FMS Reliability. His passion is working with teams to create cost-effective reliability programs that solve problems, create durable and reliable products, increase customer satisfaction, and reduce warranty costs. If you enjoyed this articles consider subscribing to the ongoing series at Accendo Reliability.


