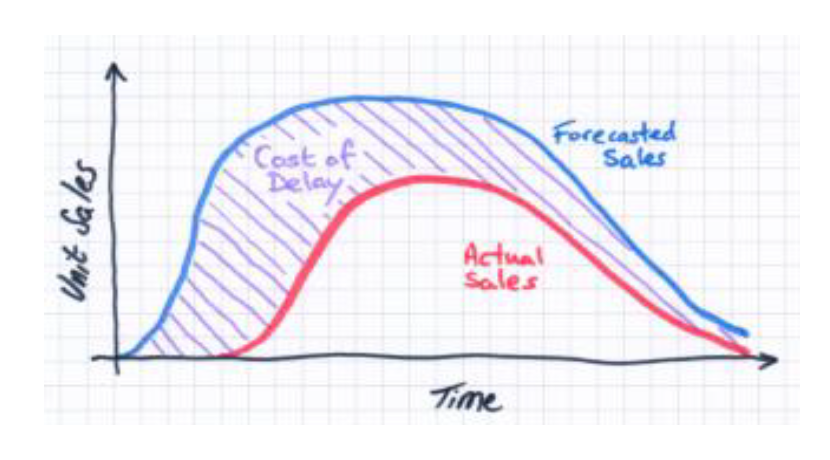
 The cost of delay on technical projects averages tens of thousands of dollars per day in lost profit. Major factors involved in these delay costs are lost revenue, cost of resources and opportunity cost.
This briefing describes a recommended practice for estimating project delay costs and using those estimates for decision making. Cost of delay factors are first explained; followed by examples; then, recommendations for using the estimates to increase profits.
Cost of Delay Factors
Business projects have potential benefit that can’t be fully realized until the projects are completed. Revenue generating projects and cost saving projects have a direct impact to the bottom line that can typically be estimated before the project is funded and staffed. The lost revenue, profit or cost savings per day can therefore be estimated easily.
Projects such as quality improvement projects and process improvement projects often don’t have a straightforward bottom line calculation, but they still have an impact on profitability that should be estimated. Organizational development projects like leadership training development projects are very difficult to quantify in terms of bottom line impact. Estimating the delay factor isn’t always worthwhile, but your management team must realize that this delay factor still exists even if it’s not estimated.
The most straightforward project delay factor to estimate is the cost of resources. Daily resource costs that can be significant include the cost of people, equipment, and facilities. Many business unit managers don’t require their teams to calculate resource costs on projects – especially the cost of employees working on the project because headcount is viewed as a fixed expense.
Though the cost might be fixed no matter how long the project takes, the resource allocation to the project is a project expense that increases every day the team is working on the project. That increased expense diminishes the financial benefit of doing the project.
A delay cost factor that is often overlooked is the opportunity cost. For every day resources are tied up on a project, they are not available to work on other projects that have business value. The cost of delay is therefore a factor on projects in the queue before they are even started. Opportunity cost is difficult to calculate unless the business value of those opportunities is known in advance with excellent portfolio management practices.
Examples
A straightforward example is a portfolio of projects involving contracts. Because contracts have revenue and profit estimates that are easy to calculate, the major delay cost factors can also be easily calculated.
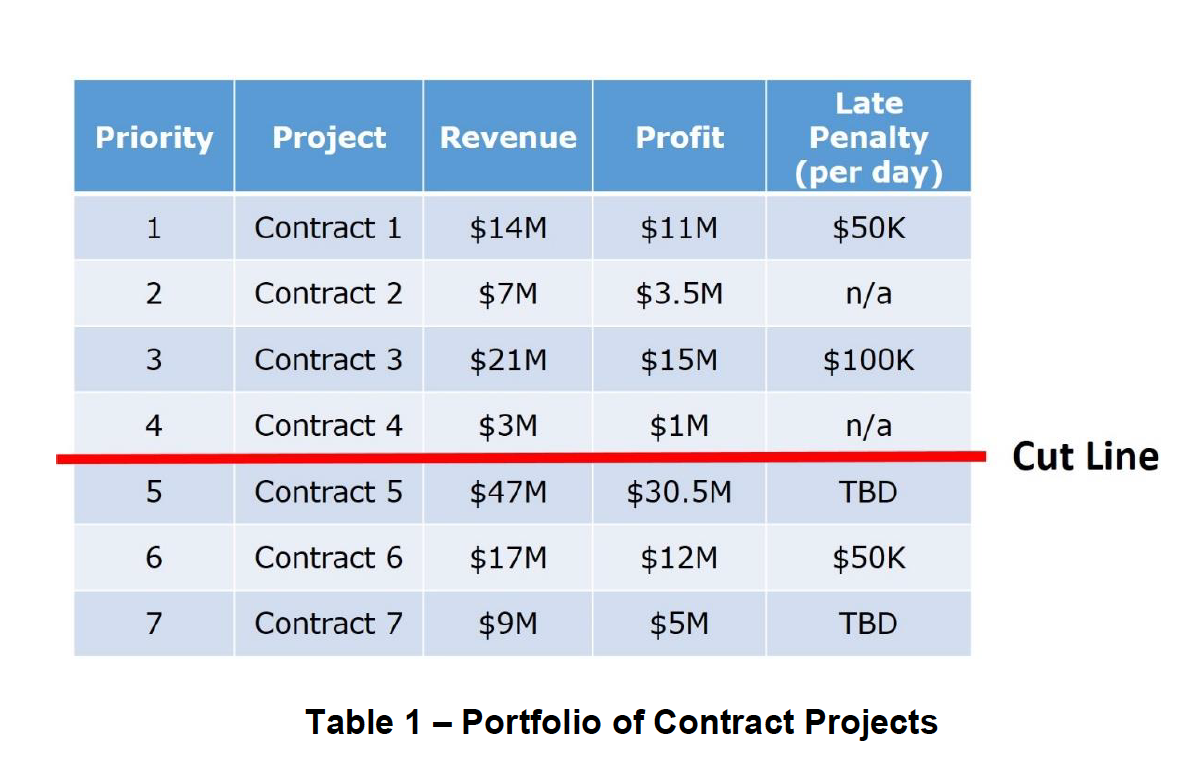
Table 1 shows a project portfolio that is prioritized based on commitment dates (not shown) and relative importance of the contract. Projects below the cut line are opportunities in the early planning stages. These contracts have not been secured and resources are not yet committed.
Using Contract 1 as an example, the cost of delay calculation might look like this:
The lost profit is this example is simply the daily penalty specified in the contract if the project goes past the due date. The resource cost is the burdened cost of labor. Contract 1’s team size is 10 people and the daily burdened cost for each team member is $1,200 (in the ballpark for a typical engineer in the U.S.).
Opportunity cost can be estimated in several ways, depending on the situation. In this example, Contract 6 will be staffed by the team working on Contract 1, and there is risk of losing the contract if the team is not available soon. With the profit opportunity being $12M and the estimated time to complete being 130 business days, if it becomes a missed opportunity the daily profit loss would be $92K. Certainly the $12M total loss is much more significant, and that figure should be used for Contract 6 staffing considerations.
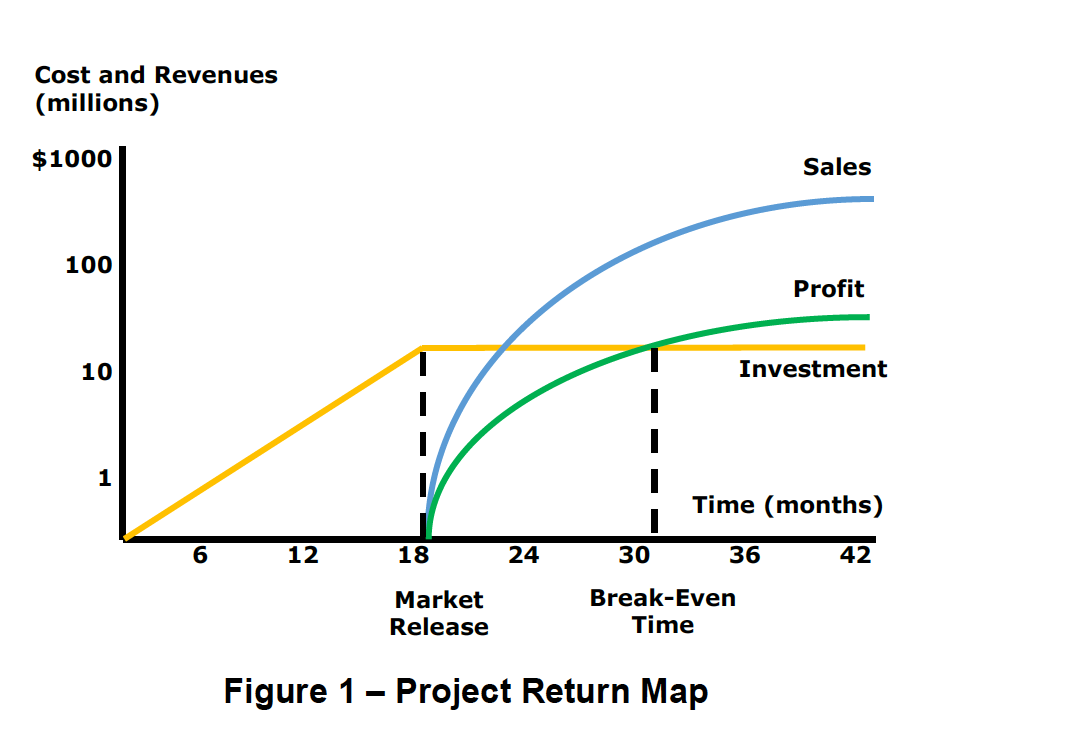
This next example involves a portfolio of products that are being developed for a general marketplace with profit projections for each project. A project return map similar to Figure 1 is used along with other criteria to determine the business value and to prioritize the projects.
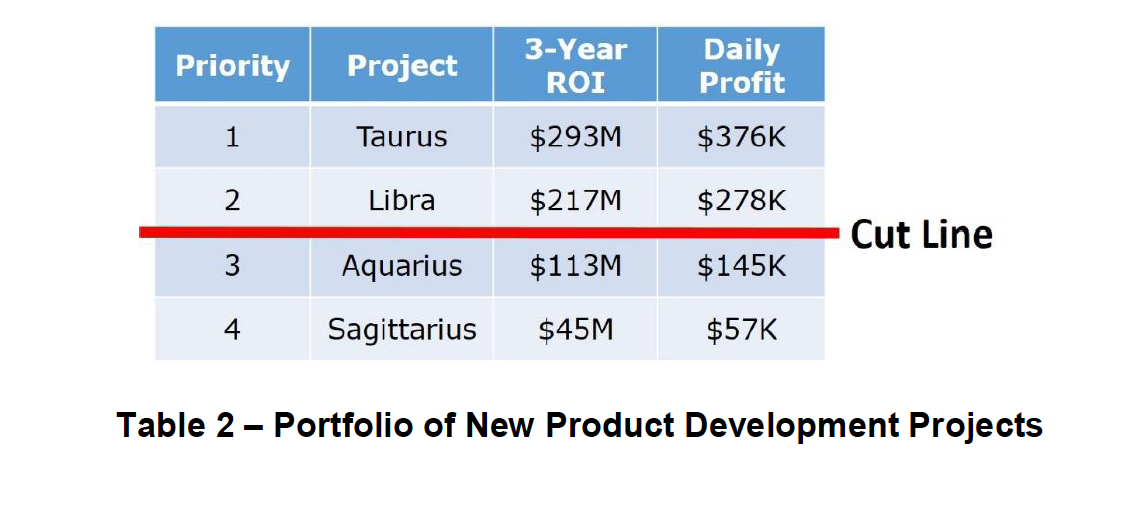
The priorities are shown in Table 2, without considering the cost of delay for each project. Aquarius and Sagittarius are in the queue to be started. Aquarius will be staffed mostly from the Libra team, and Sagittarius will be staffed mostly from the Taurus team.
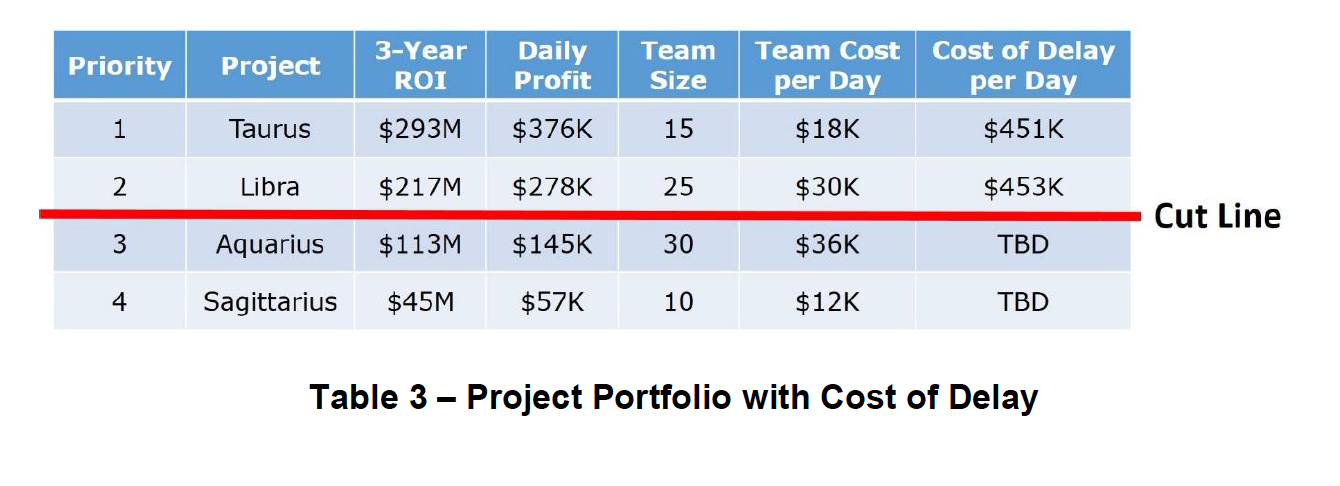
Table 3 shows the cost of delay calculations for Taurus and Libra.
The cost of delay figures include opportunity cost as shown below.
Libra’s cost of delay exceeds Taurus’ cost of delay, but the daily profit from Taurus justifies keeping that project as top priority. Finding ways to accelerate both Taurus and Libra would be worthwhile because of the very significant delay costs.
A final example involves a portfolio of projects that don’t all have clear profit figures. Table 4 shows three projects that are prioritized using a team scoring system. Tesla is a technology development project that is nearly complete. The revenue and profit benefits are unclear, but it is top priority for customer attractiveness and long-term strategic reasons. The plan is for the Da Vinci project to be staffed by the Tesla team when Tesla is finished.
A final example involves a portfolio of projects that don’t all have clear profit figures. Table 4 shows three projects that are prioritized using a team scoring system. Tesla is a technology development project that is nearly complete. The revenue and profit benefits are unclear, but it is top priority for customer attractiveness and long-term strategic reasons. The plan is for the Da Vinci project to be staffed by the Tesla team when Tesla is finished.
With an understanding of delay costs, projects can be reprioritized based on delay cost as a factor. Cost of delay estimates also justify accelerating certain projects.
In this example it might seem best to prioritize Da Vinci ahead of Tesla because of the clear profit estimates and the larger cost of delay. However, Tesla is scored highest based on many criteria that are important to the business, and delaying Tesla could be much less profitable in the long run. With Tesla remaining as top priority, there is clear justification for accelerating the project by increasing efficiency or adding resources.
Using Cost of Delay Estimates
The main benefit of estimating project delay costs is to determine which projects should be accelerated. Projects can be accelerated in three ways:
1. Increase efficiency
2. Add resources
3. Reduce scope
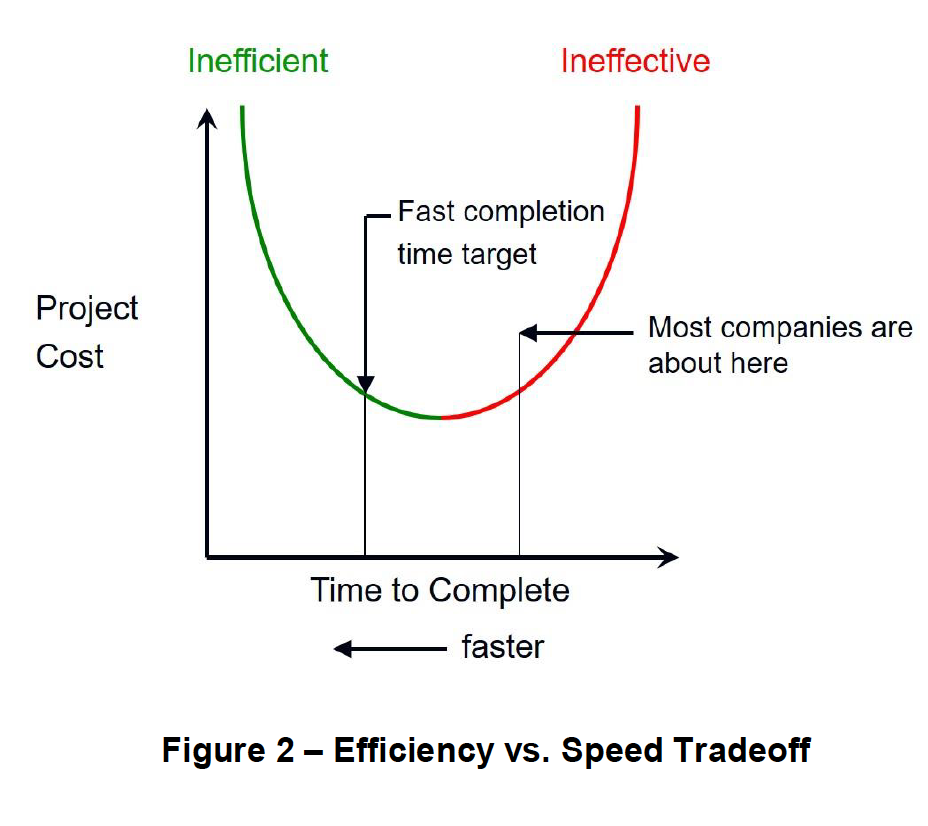
In their book Developing Products in Half the Time, authors Smith and Reinertsen illustrate efficiency vs. speed tradeoffs using a graph similar to Figure 2. The curve represents a project’s minimum cost vs. completion time, assuming continuous work. Spending above the curve is typical. Most organizations have the general opportunity to accelerate projects and also to increase efficiency. The point on the curve labeled “Fast completion time target” is ideal for many projects (somewhat inefficient spending). Throwing money at a project to speed it up often results in spending far above the curve, so it’s important to pay attention to efficiency unless delay costs are extremely high and the fastest possible speed is necessary.
When projects have very high delay costs, inefficient spending as shown on the far left of the curve is usually worthwhile. Having tangible cost of delay estimates helps to make these tradeoff decisions.
Accelerating projects by increasing project management strength is a major opportunity for many businesses. Project methodologies such as Agile and Rapid Iterations Project Management (RIPM) can help to significantly accelerate projects and increase efficiency.
About Auxilium
Founded in 2002 by lead consultant Gary Hinkle, Auxilium helps engineering-oriented businesses increase productivity, manage special projects, and develop talent. Call or text Gary Hinkle directly at 971-222-6234 or email: gary@auxilium-inc.com to learn more about cost of delay estimates and consulting services offered by Auxilium.
