 Risks, like tsunamis, start as ripples far away; as they approach us they gather momentum, speed and force. A tsunami making land and causing devastation is a horrific reality; how well you monitor the ripples will decide your emergency plans.
Risk velocity is a relatively new concept within the risk management scene. It strays away from traditional “two-dimensional” risk management practices and offers an extra dimension for consideration: the speed at which risk impacts an organisation.
Much like the standard understanding of velocity in physics, risk velocity concerns the pace of a risk’s movement from one point to another. Consider those two points as “inception” and “impact”. The faster the risk travels between inception and impact, the greater its risk velocity.
Risk velocity allows us to identify those circumstances where we may or may not have a lot of time to respond effectively to a risk impact. As a result, this allows us to better plan for, respond to, and manage our risk response practices. This also aids in our ability to better recover from a risk impact, a matter which we can similarly term as our “recovery velocity”. This recovery velocity can be used to better guide decision making in the context of business continuity and recovery planning.
Here’s a scenario: imagine your organisation has just been slammed by a damning, viral social media post which destroys its reputation. The rate at which this information can spread online and consequently “infect” your organisation’s image is rapid. This would deem it as a high velocity risk. It moves quickly. It impacts quickly.
Here’s another scenario: imagine your organisation has its assumptions about market preferences for its product or service. Let’s assume you haven’t updated your organisation’s understanding of those preferences, and how they’re changing, for some time. Preference shifts within markets are typically slow. This would deem it as a low velocity risk. It moves slowly. It impacts slowly.
Ultimately, risk velocity is about speed. It’s also about how quickly and effectively your organisation responds to it. This provides you with a great opportunity to evolve your risk management practices beyond traditional two-dimensional means by adopting a modern, three-dimensional approach with the help of risk velocity. So, that leads us to the next question: how do we calculate risk velocity?
How to calculate risk velocity
As we mentioned before, risk velocity is the speed at which a risk impacts an organisation. You would assume that this would see it calculated in a purely quantitative manner. While quantitative approaches are popular, qualitative and intuitive approaches also have their place. This place is typically within smaller scale organisations who may not allocate as many resources to calculating risk velocity when compared to their larger counterparts.
Quantitative approaches, however, are the most popular approach of the two. This is due to its ability to better express risk velocity with an actual quantified unit. This quantified unit also makes it easier for that value to be plotted on risk management charts. As a result, this also typically makes it easier for people interpreting those charts to understand the velocity of the risk at hand. While quantitative approaches can of course be used in smaller organisations, they typically find their place within large organisations with designated and solid risk management teams.
As risk velocity is still in its early stages, many risk practitioners have attempted to create models to represent it. To date, there is no single model which is uniformly preferred or used across risk management practice. Rather, organisations adopt those models which they best prefer and which best suit their business and risk needs. That being said, there are a few ways to calculate risk velocity with both quantitative and qualitative methods. I’ve collated some of the most popular methods below.
Method #1: Standard calculations
Standard quantitative calculations are great for determining risk velocity. This is also a great approach to use if you’re just after a figure to use in isolation from risk management charts. That being said, this is a great way to calculate figures to include in your risk management charts. Typical equations for doing so include (Likelihood + Velocity) x Impact and (Likelihood x Impact) + Velocity. When calculating Velocity in this instance, it is helpful to have a scale to guide you. This doesn’t need to be a complicated scale – it can be as basic as a scale of 1-5 which ranges from low velocity, to medium velocity, to high velocity. When determining this scale however, consider velocity factors such as the degree and length of the risk impact.
Method #2: Adding risk velocity to a risk impact or score
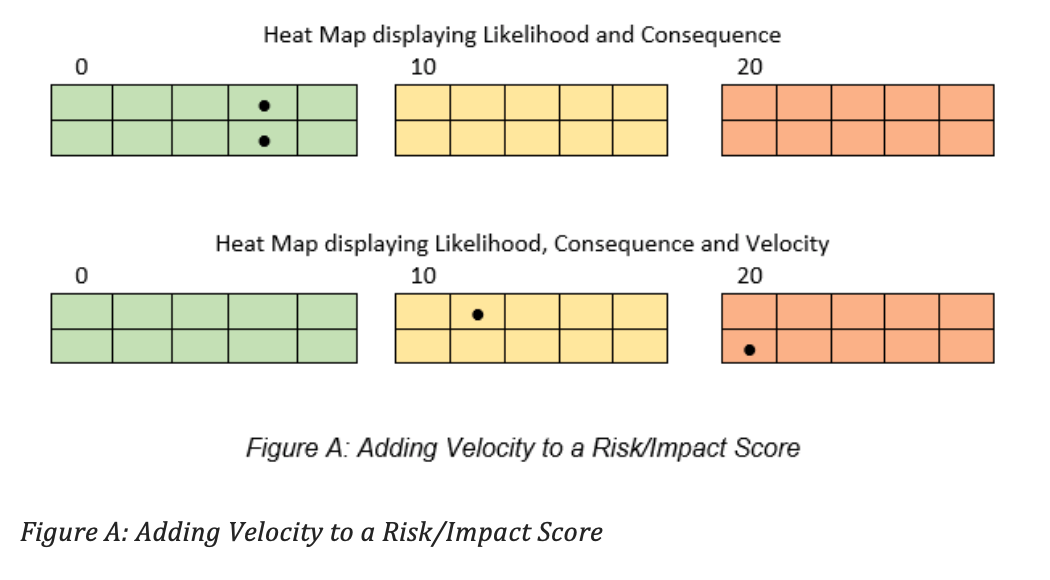
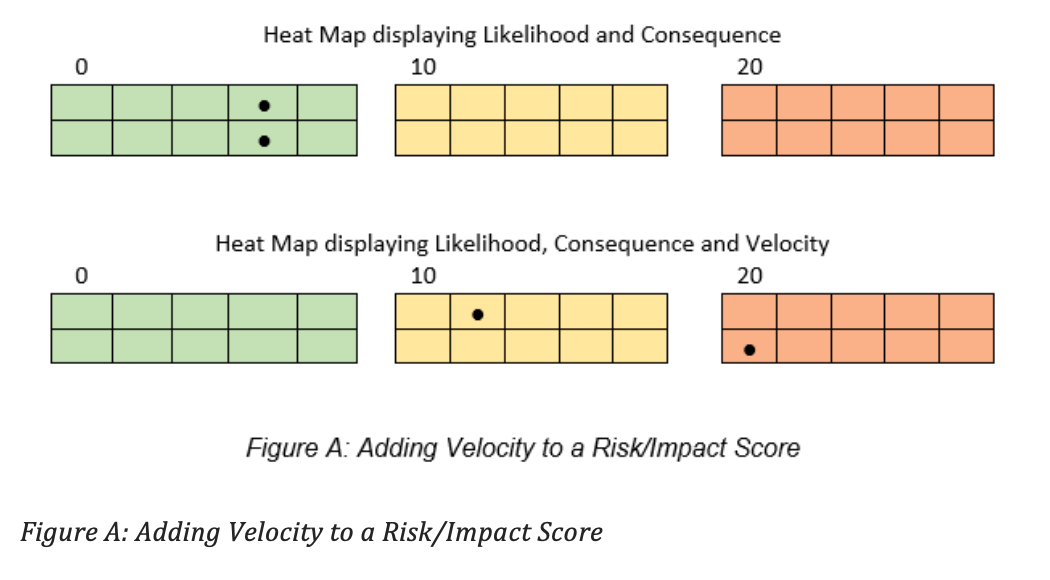
This is arguably the most popular approach to calculating risk velocity, noting that it is a quantitative approach. This involves considering velocity as a number to be added to a risk score, and then plotted on a linear scale. This is considered as the “first half” of the score. The “second half” of the score is then calculated by adding an additional rating for velocity. This is usually calculated as the Total Risk Score = (Impact x Likelihood) + Velocity. See Figure A below for a visual.
Method #3: using visual cues to represent risk velocity
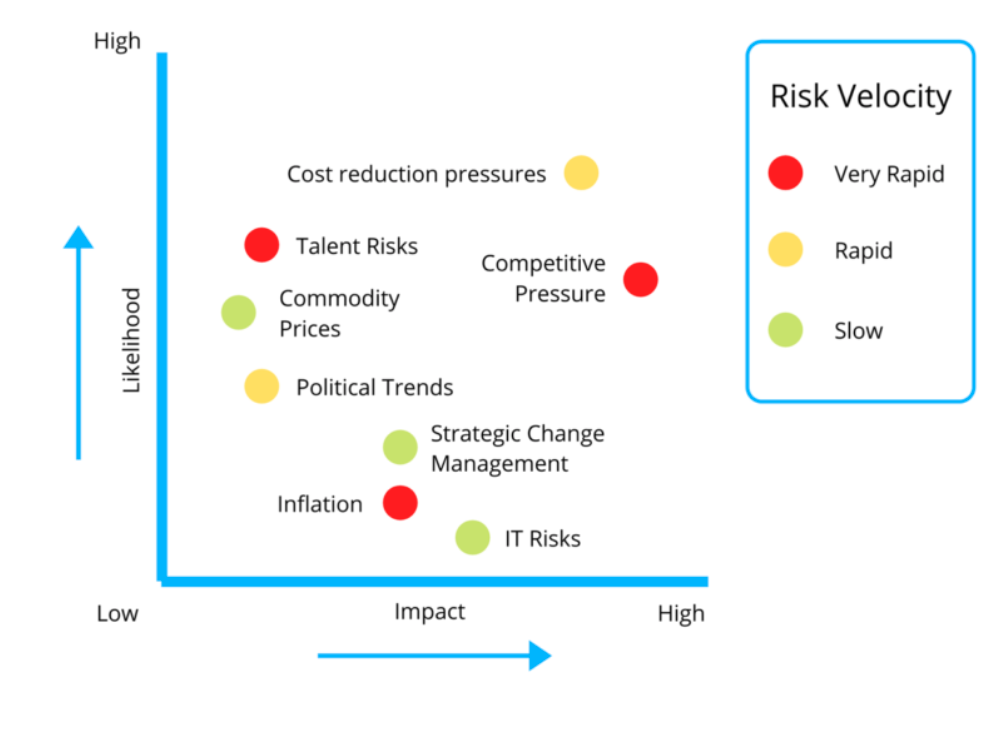
Another approach, albeit less popular than the one above, is to overlay a risk velocity rating to the traditional two-dimensional framework rather than as an added dimension. Users just need to then plot risks on a traditional heat map together with a symbol which is usually a different colour, shape or size for each relevant risk. It’s also quite common to use larger shaped symbols for larger scale risks. See Figure B below for an example.
Method #4: Bow tie analysis
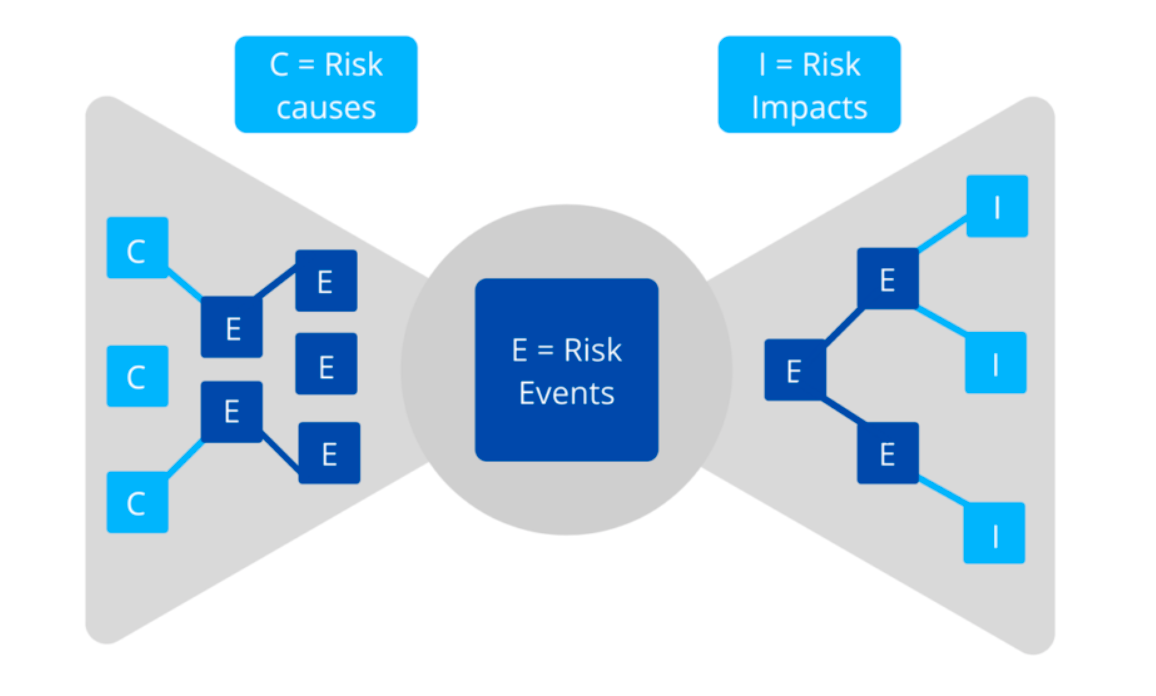
Another popular approach is that of the “bow tie analysis”. This qualitative approach shows elements, behaviours and relationships between different risks. This analytical tool is great for demonstrating, documenting and visualising the stages of risks and how they interrelate. Stages in the risk analysis process which are included in the bow tie analysis are the root cause of the risk, its subsequent events, and its impacts. Check out Figure C below for an example.
What to be cautious of
While best practice is to adopt the third dimension of risk velocity to your risk management practices, it is also important to do so in a manner which doesn’t over complicate your current risk practices. A lot of this confusion can come from poorly designed matrixes and charts. For this reason, it is critical that Risk Managers and Boards assess risk and communicate it in a manner which can be easily understood. Failing to do so could find your risk velocity calculations redundant.
You should also be cautious about using an intuitive approach to risk velocity as it doesn’t always translate well into practice. This is especially the case for larger organisations. To avoid this, it is best to adopt a quantitative approach and document it. This will save you a lot of time in actually responding to risk impacts when, and if, the time comes.
What you should be doing
Despite having mentioned that risk velocity is typically used in larger scale organisations, this shouldn’t prevent smaller scale organisations from using it too. Regardless of your organisation’s size, adopting this approach is prudent. So, your organisation and your Board, regardless of size, should be incorporating risk velocity into its risk planning and management activities. This is a matter which is best employed from the top-down and should be addressed periodically with risk monitoring scans.
If you have any stories – good or bad – about risk velocity, I would love to hear them.
If you’re looking at incorporating risk velocity into your risk management practices and would like some guidance or a conversation to help you on your journey, please contact me. I’m more than happy to guide you.
About the Author
Peter is the Founder and Director of Holtmann Professional Services, a global provider of executive coaching, business excellence consulting and career path development. Peter has 20 years of experience in executive roles and has been the President and CEO of a global non-profit. Peter has written for many journals and blogs, is a keynote speaker and is a champion of prosperity through excellence of leadership.
If you are interested in working with Peter, please reach out to enquiries@holtmann.com.au.


