 When it comes to reporting organisational performance, risks, and compliance, especially in an integrated manner, we have become lazy or opportunistic.
A risk manager once told me how she has put together three arch lever folders of documentation for the upcoming Board meeting in her organisation. And she was so proud of her achievements!
Three things crossed my mind when she said that.
Firstly, how on earth will I be able to read and comprehend such voluminous information in one week before the scheduled meeting? How can the Board pick out the key issues for meaningful discussion and make good decisions? (As a board member myself, this is problematic.)
Secondly, what is management trying to hide – intentionally or unknowingly? What is buried in these mountain of papers that I must know to discharge my duties and legal obligation as a Board member?
Thirdly, it is so easy to get into the weeds and totally miss key issues. The Board can miss out on the things that matter most to the organisation and for its survival.
Instead of spending 70% of the Board’s time on strategic forward-looking issues, the Board can easily spend over 90% of their time on operational or internal issues, going right down into the weeds.
In essence, the Board is performing management’s work, or not discharging their board responsibilities effectively.
Unfortunately, there are many boards that fall into this category.
My philosophy
My philosophy is this – It takes much more effort and thinking power to summarise three arch lever folders of Board documentation into 10 pages or less!
The shotgun approach to reporting must cease i.e., lets bombard the Board with mountains of paper. Management must partner with their Boards to get the best outcome for the organisation. Board reporting is not mere compliance.
Sack the clueless board members
To be fair to my risk manager friend, the Board may also be contributing to the problem. They have not clearly stated what specific information they expect to receive and in what form and depth to discuss and make decisions that matter most to the organisation.
If a Board cannot clearly articulate what information it requires to discharge its duties and make good decisions, then sack its members!
Strategic Board reporting in less than 10 pages!
I have been on a crusade journey to simplify Board reporting for the purposes of understanding, discussion and accountability. Especially so when I am now sitting on various Board committees and subcommittees.
With some degree of success, I have been working closely with management teams on the committees I am sitting on to simplify Board reporting. Rather than reading disparate or voluminous reports, I am integrating performance, risk, and compliance reporting into one summary report that promotes meaningful discussions.
If Board members want the details, they are available on request. It should be an exception rather than the norm.
Reporting on ALL areas of your business
As a Board member, I must have oversight or a strategic view over ALL aspects of the business. I cannot rely on management to tell me things I must know, especially on a selected basis.
Build your organisation’s entire business model into your reporting framework.
Keep your fingers on the pulse of the entire business. This will ensure that you do not miss anything but have an eye on everything. I mean everything. There should not be any self-selection or discretion by management.
In doing so, you will always be wholistically monitoring the performance, risk and compliance across all elements or aspects of your business. The bigger your organisation or operation, the more simplified your executive reporting should be. It is easy to hide things with complexity.
Simplification can enhance accountability.
Stop overengineering things
Over-engineering has been a common theme for many organisations. It is time to stop that.
It will be easy to identify potential issues or trends for discussion when reporting is simplified or easy to understand. Transparency promotes accountability.
Deep dives become easier and more meaningful. Unfortunately, Boards do not take the time to perform deep dives or proactively take time to reflect and have open and honest discussions. They rather be reactive to issues that consume their time.
Because of limited time at Board meetings, the urgent get more airtime than the important.
Integrated reporting
The integrated report that I have co-developed with a CEO has been edited for this article to illustrate the concept. The concept works and the CEO loves it.
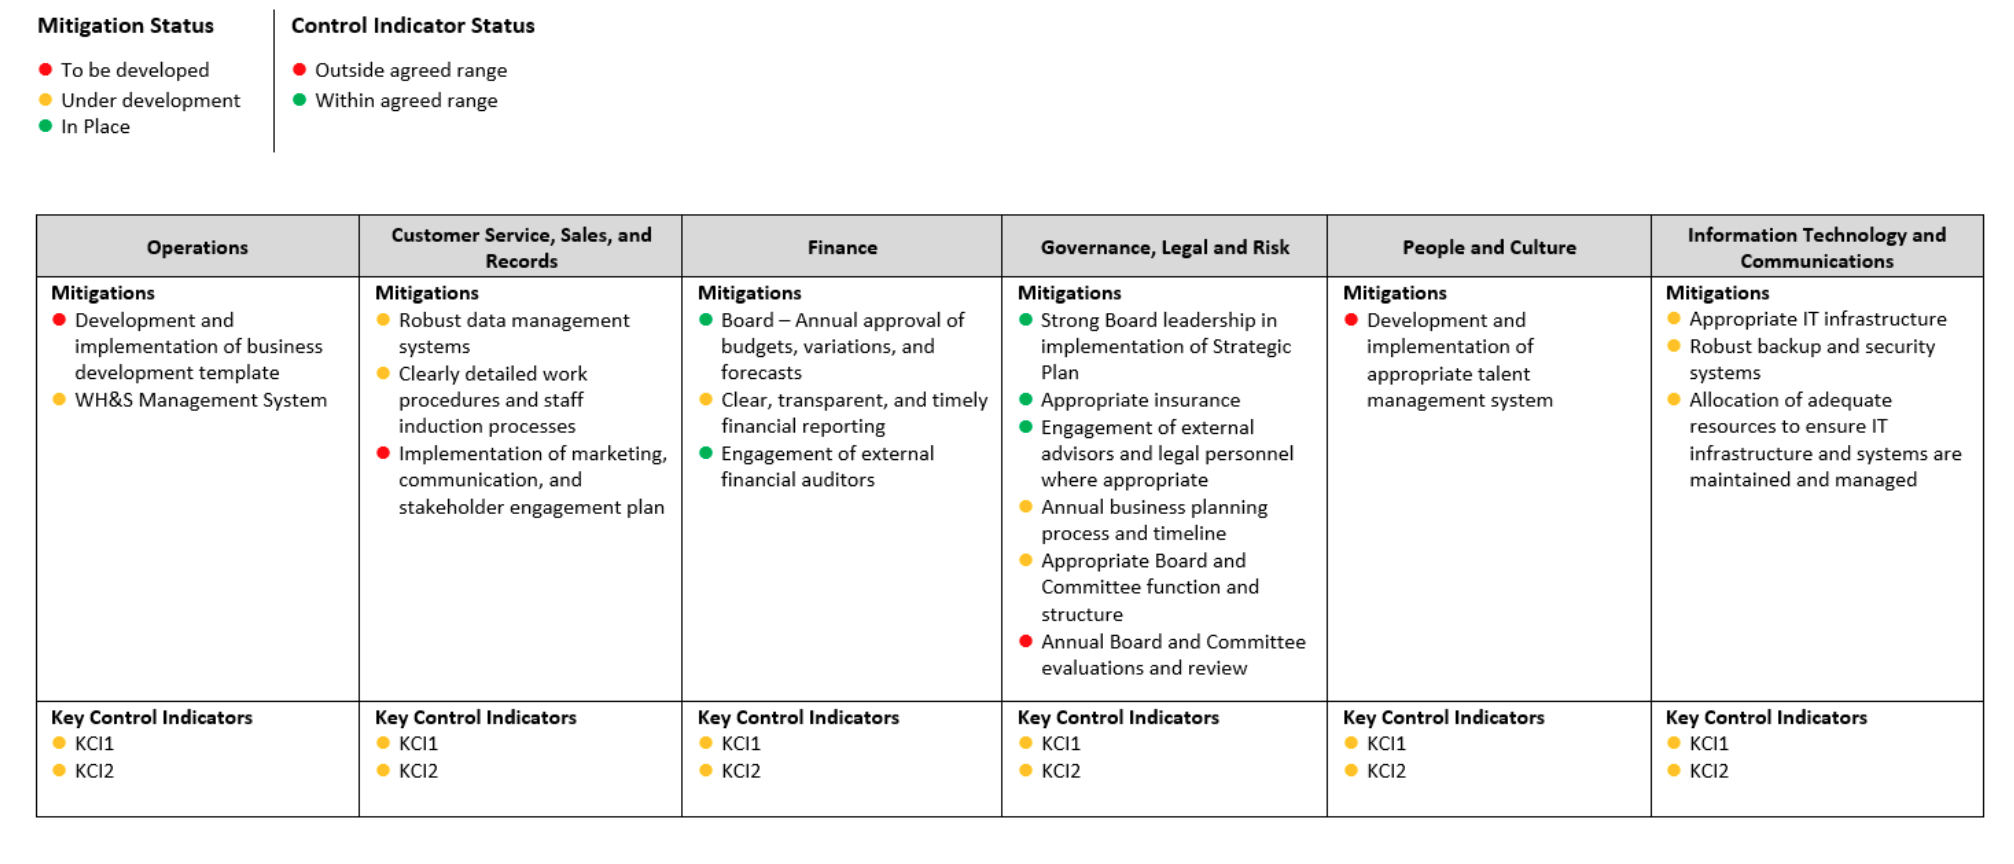
They are represented by the diagrams below. Build upon the illustrations shown in this article and customise them to your organisation.
The challenge is to develop an integrated organisational-wide performance report that is less than 10 pages that will suit your organisation and operating environment.
Information can be categorised into six focused areas, which coincide with the business model of the sample organisation.
Rather than over-engineering and over-complicating this exercise, keep them to six focus areas or less. Each focus area can be delegated or linked to specific Board members or sub-committees if required. There is clear accountability and effective oversight.
When you read the information in each focus area vertically across all tables, you will get an integrated strategic view of the following:
- Performance of each focus – Section 1.
- Effectiveness of each organisational policy and standard (control environment) – Section 2.
- Legislations (acts and regulations) and external requirements (compliance) – Section 3.
- Risks and mitigations linked to performance, policies, and compliance (risk management) – Section 4.
When you read the information horizontally across each table in Sections 1 to 4, you will get a complete or consolidated picture of the organisation’s performance, policies, compliance maturity, risk profile and control environment across the entire business.
For each section, use key performance indicators (KPIs), key risk indicators (KRIs) and key control indicators (KCIs) to meaningfully quantify your performance or non-performance.
The traffic light system of red, amber, and green is used to indicate actual progress.
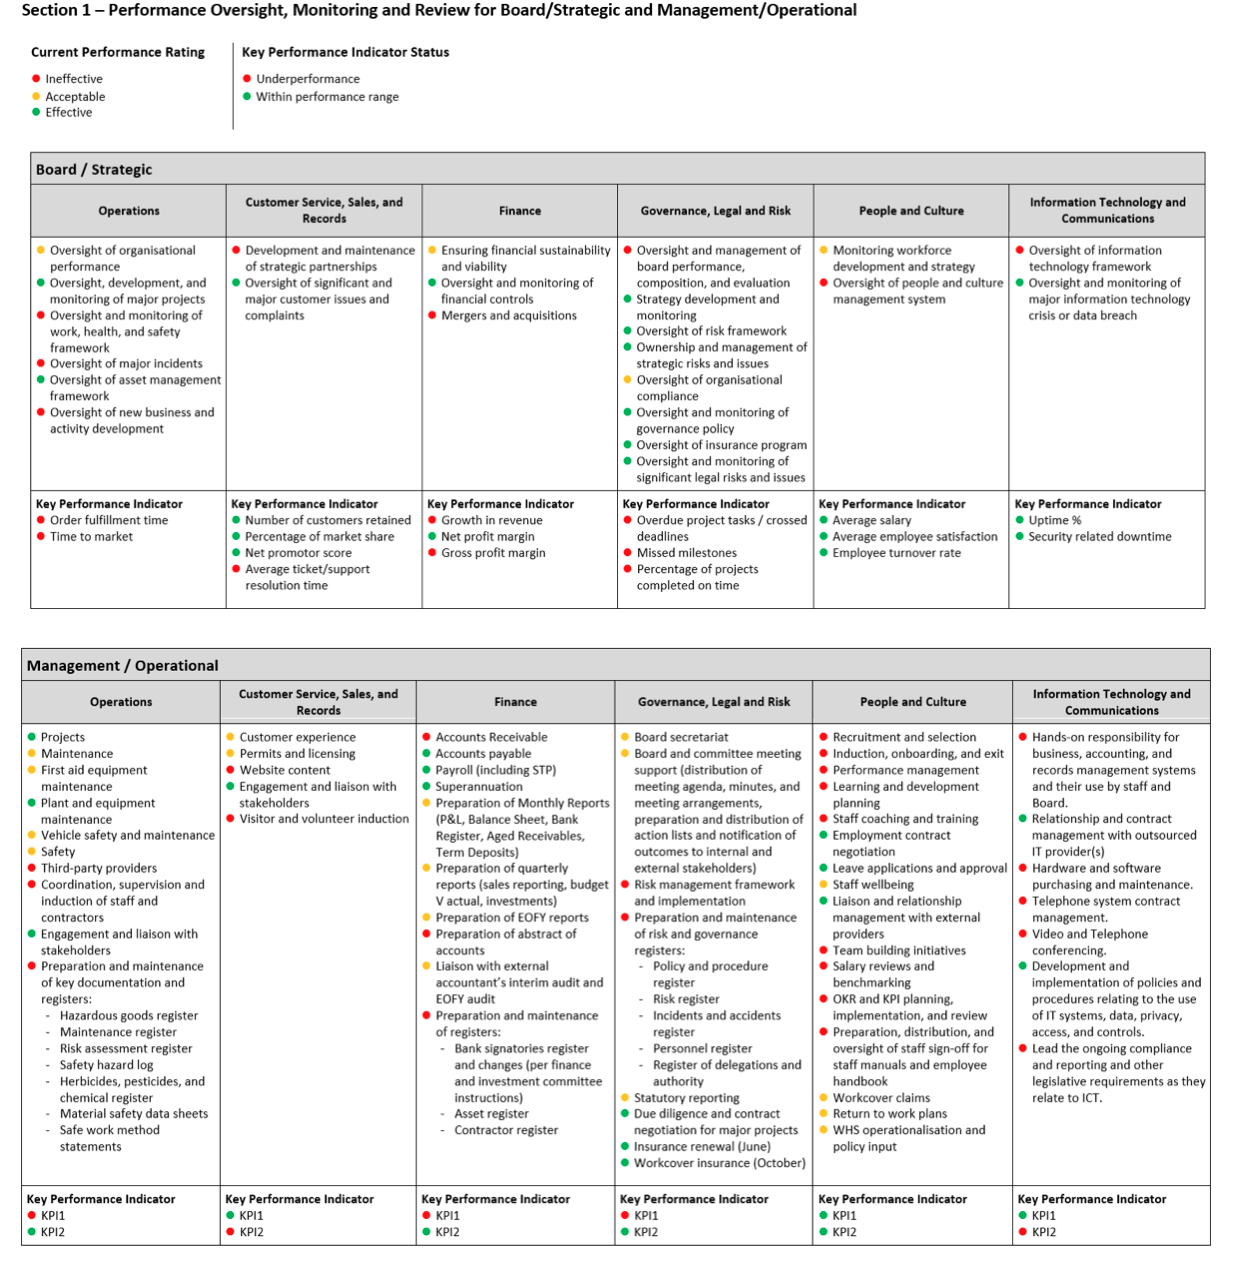
Section 1 – Performance oversight, monitoring and review for Board and Management
The two sub-tables in this section draw the much-needed accountability line that is lacking in so many Boards.
This line clearly separates what the Board is accountable for and what management is accountable for. There is no exception.
Unfortunately for many organisations, this accountability line between Board and management is somewhat unclear and causes confusion.
Key performance indicators are included for clarity and accountability. Performance measures are important to hold management accountable and focuses on things that matter most to the organisation.
Problem areas can be identified. Board members can focus on those non-performing areas and take proactive steps to mitigate any non-performing areas.
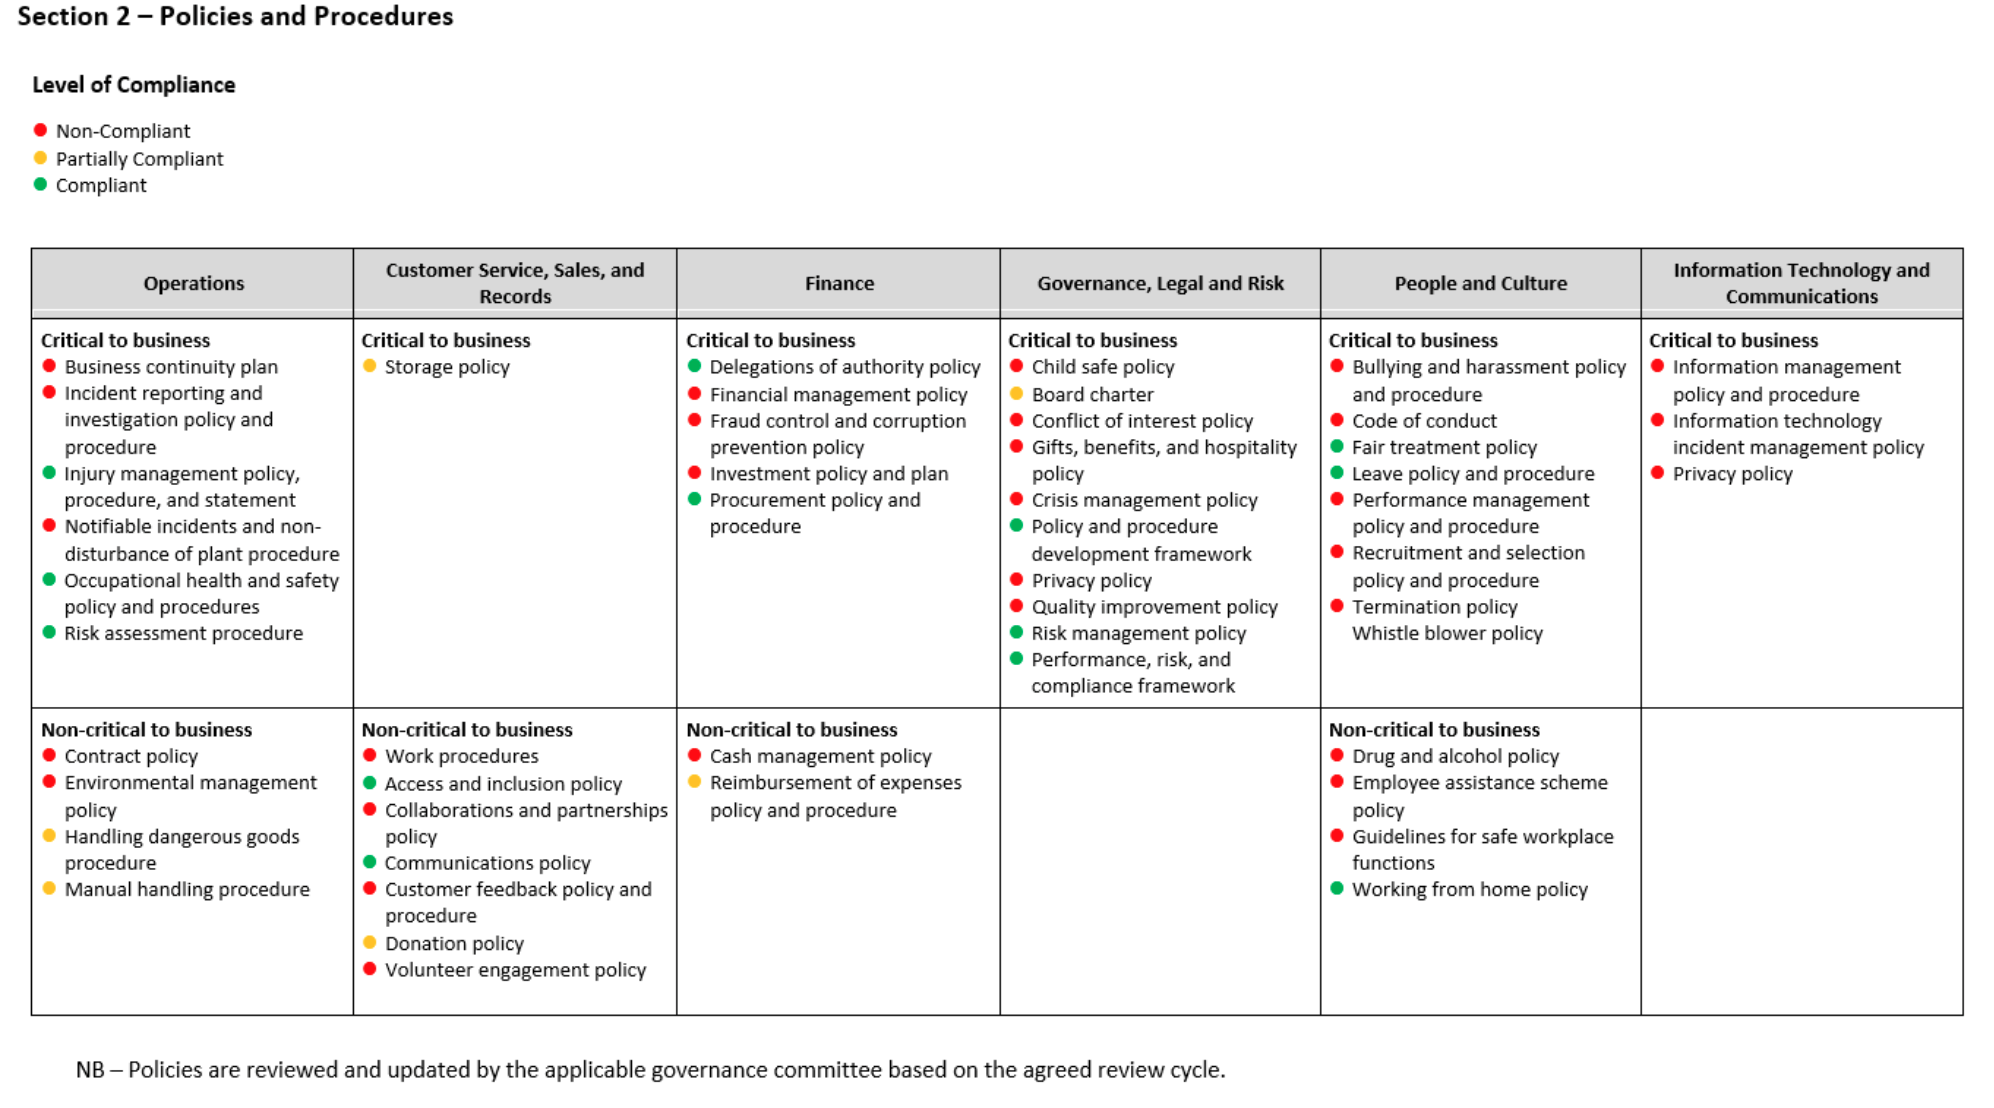
Section 2 – Policies
This section sets out all applicable policies, standards, etc. operating in the organisation. These are rules of the game that organisations must follow.
If the organisation has too many policies, then it is time to consolidate or retire them. Drowning employees with meaningless policies can be problematic and counterproductive.
Listing out all policies in one table and on a page will ensure that the Board will have the opportunity to review them holistically as part of the lifecycle management process. It prevents the organisation from layering on conflicting or multiple policies. This forces management to consider the purpose of each policy before it is developed or reviewed and be targeted as to their intended outcome.
Having a handful of key policies will ensure understanding and compliance by employees.
Section 3 – Legislation / external requirements
This section lists key legislations that your organisation must comply with externally to achieve its strategic objectives. The level of compliance of each legislation is also marked out. Non-compliance is actioned.
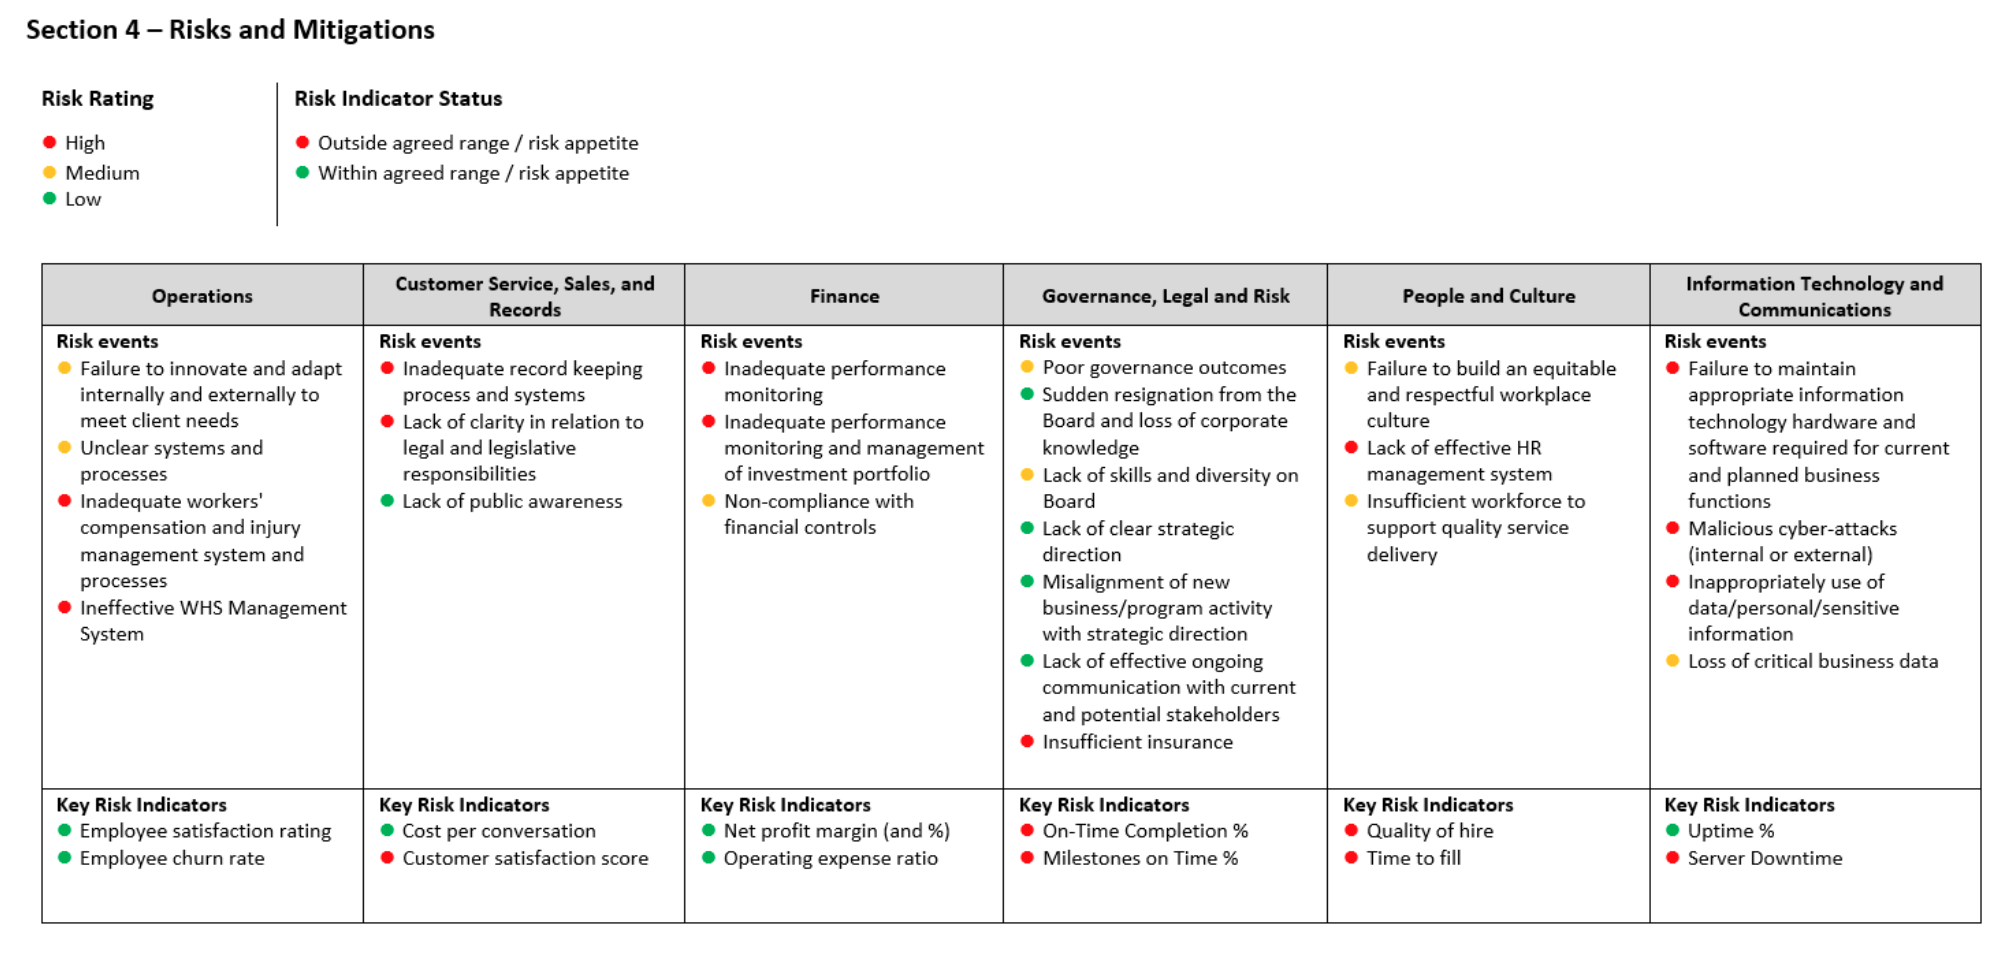
Section 4 – Risks and mitigations
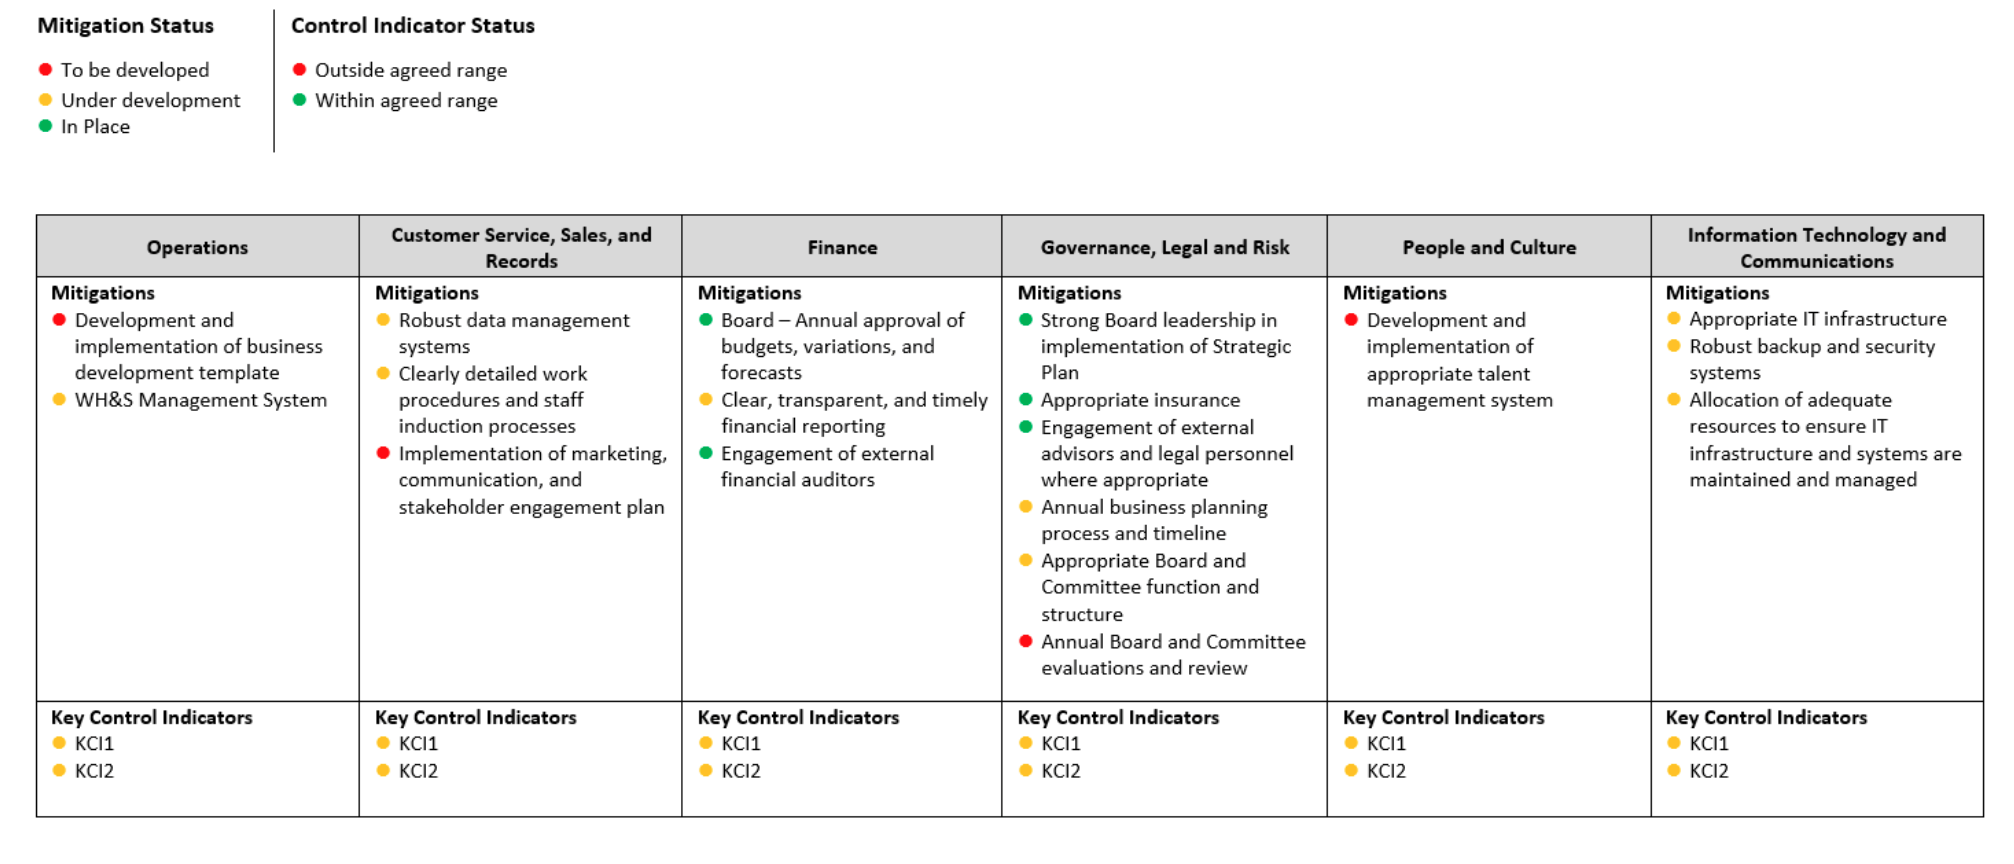
This section is the cumulative list of key risks vertically across all focus areas. It lists their corresponding mitigations, at a high level.
The risk level is assigned together with the implementation status of each risk mitigation. Without effective implementation tracking of the proposed mitigations or treatments, your risk management is ineffective.
Key risk indicators and key control indicators can be actively used to bring more focus to Board oversight, discussions and actions.
KPI, KRI and KCI
These three types of indicators are related. They must be used throughout the report.
(1) Key performance indicator (KPI)
This indicator enables an organisation to define its performance targets based on its goals and objectives and to monitor its progress towards achieving these targets. Any deviation can be proactively actioned.
KPIs are used to answer the question – Are we achieving our desired levels of performance or targets?
KPIs can be financial and non-financial in nature and leading or lagging. They can be quantitative or qualitative in nature.
An example of a KPI – Number of loans for clients who have past defaults.
For an airline, an excellent KPI is “planes leaving on time”. Only one KPI for the Board to keep track. Everything else sits under this one strategic KPI as operational KPIs.
(2) Key risk indicator (KRI)
This indicator helps define the organisation’s risk profile and monitor changes in that profile. If selected well, KRIs can high emerging risks that require Board attention.
KRIs are used to answer the question – To achieve our targets, how is our risk profile changing and is it within our desired tolerance levels?
Where KPIs tell us if we are achieving our targets, KRIs help us to understand the changes in our risk profile and the impact and likelihood of achieving our targets.
Like KPIs, KRIs can be financial and non-financial in nature and leading or lagging. They can be quantitative or qualitative in nature.
The easiest way to develop a KRI is to use an existing KPI because performance and risk are two sides of the same coin.
An example of a related KRI to the KPI above is the “number of loans that have past defaults and do not have sufficient collateral cover”.
(3) Key control indicator (KCI)
This indicator helps the organisation define its control environment and monitor levels of control relative to desired tolerances.
KCIs is used to answer the question – Are our organisation’s internal controls effective to enable us to achieve our targets? Are we ‘in control’ of our destiny?
An example of a KCI that relates to the KPI and KRI above is the “number of clients with insufficient collateral cover”.
KPIs, KRIs and KCIs inter-relate to each other to provide a holistic performance picture when they are presented together in one consolidated or integrated report rather than in silos or disparate reporting.
Meaningful Board discussions and deep dives on priority matters
When the Board has a strategic performance dashboard of the entire organisation that includes inter-related KPIs, KRIs and KCIs that join the performance dots, members and other stakeholders can ask the right probing questions of management.
This is where the Board has a legal duty to constantly challenge management and hold them to account. They can only do so when they have access to the right information.
Deep dives on areas of concern can be scheduled and timely proactive actions can be made to address any performance issues.
It is legal duty over trust. Trusting management to drip feed ‘good news’ to the Board is a recipe for failure. And we have seen this all the time, unfortunately!
Professional bio
As a Chartered Accountant with over 25 years of international risk management and corporate governance experience in the private, not-for-profit, and public sectors, Patrick helps individuals and organizations make better decisions to achieve better results as a corporate and personal trainer and coach at Practicalrisktraining.com.
