 True risks are often different than perceived risks. Due to human curiosity, the desire to sell news, 24-hour-a-day news blitz, and current trends, some folks have a distorted sense of risks. Most often, people fear the lesser or trivial risks and fail to respect the significant dangers faced every day.
We live in a dangerous world. Yet it is also a world safer in many ways than it has ever been. Life expectancy is up. Infant mortality is down. Diseases that only recently were mass killers have been all but eradicated. Advances in public health, medicine, environmental regulation, food safety, and worker protection have dramatically reduced many of the major risks we faced just a few decades ago.
Risk issues are often emotional. They are contentious. Disagreement is often deep and fierce. This is not surprising, given that how we perceive and respond to risk is, at its core, nothing less than survival. The perception of and response to danger is a powerful and fundamental driver of human behavior, thought, and emotion.
Individuals tend to overestimate the risk of death by tornado but underestimate the much more widespread probability of stroke and heart attack.
The public ranks disease and accidents on an equal footing, although disease takes about 15 times more lives. About 400,000 individuals perish each year from smoking-related deaths. Another 40,000 people per year die on American highways, yet a single airline crash with 300 deaths draws far more attention over a long period of time. Spectacular deaths make the front page; many ordinary deaths are mentioned only on the obituary page.
“Most people are more afraid of risks that can kill them in particularly awful ways, like being eaten by a shark, than they are of the risk of dying in less awful ways, like heart disease—the leading killer in America.
One US publication reads that in 2021, two U.S. citizens died from shark attacks, and 934,110 citizens (2020) died of heart disease. Which one generally appears as a headline news article?
A tragic story of a 3-year-old boy in Florida (2017) illustrates this point. This young boy was in knee-deep water picking water lilies when he was attacked and killed by an 11-foot alligator. The heart-wrenching story was covered on television and in many newspapers around the nation. The Florida Game Commission has kept records of alligator attacks since 1948, and this was only the seventh fatality.
Many loving parents probably instantly felt that alligators are a major concern. However, it could be that the real hazard was minimum supervision and shallow water. Countless young children unceremoniously drown, and little is said of that often-preventable possibility. The National Safety Council stated that in 2020, 900 people drowned on home premises in swimming pools and in bathtubs.
Of that number, 350 were children between newborn and 5 years old. ABC News estimated that 50 young children drown in buckets each year, but we are familiar with buckets and do not see them as hazards.
In common usage, the word” risk” has several meanings. Risk often refers to the probability or possibility of a loss. Alternatively, the word risk is used to refer to the magnitude of a possible loss. However, risk describes a combination of both the consequence and likelihood of a loss.
High-risk events are high probability resulting in large consequences or losses. Low-risk events are unlikely events resulting in no significant losses. Risk is always the result of Consequence multiplied by Likelihood.
Risk = Consequence × Likelihood
This is a simple enough equation; however, like all equations it is meaningless unless the units of measure are known.
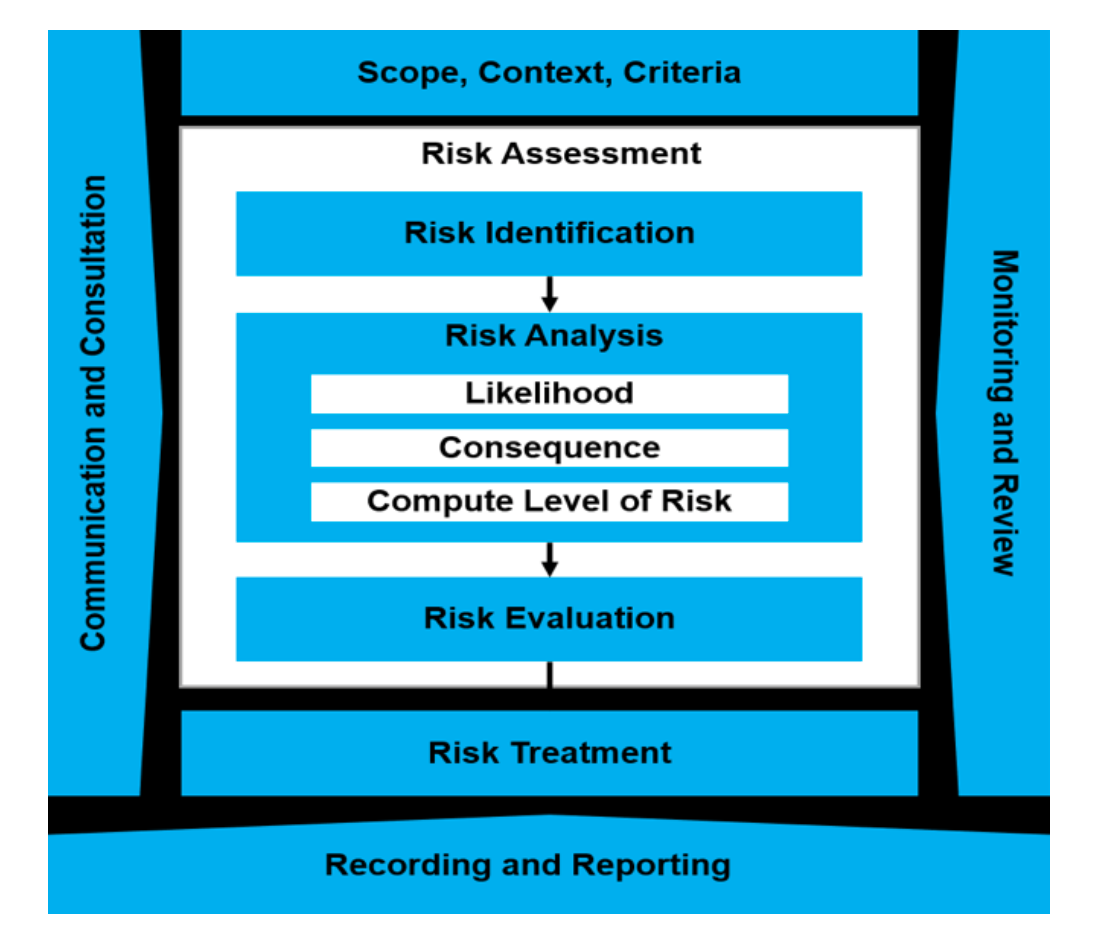
Consequence is always measured as Consequences / Event. Likelihood is always measured as Events /Year. Therefore, Risk is always Consequences /Year. To evaluate the risk of an event, both the likelihood and consequence of that event must be evaluated. Keeping the above definition in mind, consequences can be expressed in different ways.
Usually, it is expressed because of a certain event that may affect a person or company personally, financially, or legally. Common expressions for Consequence are/item Environmental Damage/Event, /item Fatalities/Event, /item Area Affected by Fire/Event, /item Area Affected by Toxic /item Exposure/Event, /item Business Interruption/Event, Equipment Damage /Event, and so on .
Agricultural pesticides, air pollution, and related chemicals (often substances bearing unfamiliar or unpronounceable names) have worried several people. Bruce Ames, a respected and renowned professor of molecular and cellular biology at the University of California at Berkeley, contends it is a waste of time to worry about man-made pesticides and air pollution. He argues:
Every plant has 40 to 50 pesticides it makes to kill off predators and fungi. They couldn’t survive if they were not filled with toxic chemicals. They don’t have teeth and claws, and they can’t run away. So, throughout evolution they’ve been making newer and nastier pesticides. They’re better chemists than Dow and Monsanto.
It is worth pointing out that almost every plant product in the supermarket is likely to contain natural carcinogens. Pomfret estimates the typical American eats about ten thousand times more natural pesticides than the residue of man-made agricultural pesticides ingested. Thus, about 99.99 percent of the pesticides we take in each day are “natural” and only 0.01 percent are man-made. (The referenced article provides a detailed discussion focusing on the fact the human body is a marvelous machine, designed to survive and prosper in a hostile world. A major section of the article describes the work of the enzymes that successfully deal with carcinogen chemical damage to our DNA.)
We enter the kitchen and open the plastic-lined refrigerator cooled by fluor chlorohydrocarbon chemicals and reach for the orange juice, which came from chemically fertilized orange groves. Many of us bring in the morning newspaper and take a quick look at the news without thinking that the printing inks and the paper itself are chemical products. Likewise, other individuals choose to turn on the morning news and do not think twice that practically every component within the television or radio was made of products produced by the chemical industry.
In short, we just do not think we are surrounded by the benefits created from chemicals and fail to recognize how the industries have enriched our lives.
The chemical industry is more diverse than virtually any other U.S. industry. Its products are omnipresent. Chemicals are the building blocks for products that meet our most fundamental needs for food, shelter, and health, as well as products vital to the high technology world of computing, telecommunications, and biotechnology.
Chemicals are a keystone of U.S. manufacturing, essential to the entire range of industries, such as pharmaceuticals, automobiles, textiles, furniture, paint, paper, electronics, agriculture, construction, appliances, and services. It is difficult to fully enumerate the uses of chemical products and processes. A world without the chemical industry would lack modern medicine, transportation, communications, and consumer products.
Dr. Bill Pomfret proposes Americans should recognize all risks in their lives and develop an approach to controlling them. He states we should not worry about minor (and perhaps even nonexistent) risk but consider eliminating major causes of cancer. Pomfret lists the risks: “First, of course, is smoking. Then there is the lack of fruits and vegetables in the diet. And finally chronic infections.”
Are We Scaring Ourselves to Death?
Several years ago, ABC News aired a special report entitled, “Are We Scaring Ourselves to Death?” In this powerful piece, John Stossel reviews risks in plain talk and corrects several improperly perceived risks.
Individuals who play a role in defending the chemical industry from a barrage of bias and emotional criticism should consider the purchase of this reference.
Mr. Stossel provides the background to determine the real factors that can adversely affect your life span. He interviews numerous experts, and concludes the media is generally focuses on the bizarre, the mysterious, and the speculative—in sum, their attention is usually directed to relatively small risks. The program corrects misperceptions about the potential problems of asbestos in schools, pesticide residue on foods, and some Superfund Sites. The video is very effective due to the many excellent examples of risks.
The ABC News Special provides a Risk Ranking table that displays relative risks an individual living in the United States faces based on various exposures. The study measures anticipated loss of days, weeks, or years of life when exposed to risks of plane crashes, crime, driving, and air pollution.
The Chemical Industries Association makes the profound statement that poverty can be the greatest threat to a long life. According to studies in Europe, Canada and United States, a person’s life span can be shortened by an average seven to ten years if that individual is in the bottom 20 percent of the economic scale. Poverty kills when people cannot afford good nutrition, top-notch medical care, proper hygiene, or safe, well-maintained cars. In addition, poverty-stricken people sometimes also consume more alcohol and tobacco than the general population.
ABC News experts developed a Risk Ranking table based upon three years of research with risk management experts. The assumption is that each of these activities are measured as independent variables, and each has a detrimental effect on your life span.
Another method of expressing risk is an index of relative risk. This measure is calculated for a group of workers as the ratio of the rate for that group to the rate for all workers. The index of relative risk compares the fatality risk of a group of workers with all workers. For example, the relative risk for truck drivers in Table 1–3 is 5.3, which means that they are roughly five times as likely to have a fatal work injury as the average worker.
Analysis of dangerous jobs is not complete, however, unless data on nonfatal job-related injuries and illnesses are examined.
Show those occupations with the largest number of nonfatal injuries and illnesses, along with days away from work to recuperate. This table shows that truck drivers also lead the list for the occupations with the largest number of nonfatal injuries and ill-nesses. It also shows the chance of incurring an occupational injury or illness which is expressed as the total number of workers in the employment group compared with the number of workers injured in that group. For example, the chance of a truck driver having a serious injury is 1 in 15, meaning that for every 15 truck drivers one will have a serious injury during the year. But laborers and nursing aides and orderlies have a greater chance of injury or illness than truck drivers
Median days away from work to recuperate is yet another measure that can be used to evaluate dangerous jobs. (Median days is an average such that half of those injured take more than the median days to recuperate while the other half require fewer days.) The median days to recuperate from an injury for the 10 occupations listed are highest for truck drivers and carpenters, each showing a median of 8 days to recuperate, compared to all workers who had a median of 5 days.
Based on the index of relative risk in the chart, truck driver is not the most dangerous occupation. This distinction belongs to fishers. Or trawler men Commercial fishers are about four times as likely as truck drivers to be killed by a fatal work incident.
Using this method of analysis, one could in fact identify even more dangerous occupations like elephant trainers who in some years have had two work fatalities. Based on employment figures of about 600 known elephant trainers in the United States, this would produce a fatality rate of 333 per 100,000 workers and a relative risk that is 68 times greater than for the typical worker. Clearly, in this analysis an elephant trainer has the highest risk of a fatal work injury even though the frequency is low or nonexistent in some years. The purpose of this example is to illustrate the importance of viewing frequency counts, fatality rates, and indexes of relative risk to discern dangerous jobs.
The occupations identified by the frequency risk techniques and a chance of injury can be used to target prevention efforts and may reduce both the number and rates of fatalities and injuries for those workers at highest risk.
Plants have placed the OSHA Process Safety Management Activities into the hands of the right people with the right motivation, the correct training, and sufficient resources to get the job done. Therefore, it would be easy to conclude that major losses are drastically declining since the 1992 Process Safety Management Regulation has been promulgated and the United States Chemical Safety Board has become active.
Despite excellent efforts in the field of process safety, there are some serious questions challenging whether enough is being done to reduce major losses. It is disappointing to note that one reputable, highly published source declares that property damage losses in U.S. refineries and U.S. chemical plants have not dramatically decreased in the past decade. In February 2003, Marsh’s Risk Consulting published the 100 Largest Losses 1972–2001, documenting significant increases in losses in their last 5-year interval. This publication is based upon 5,400 records over a 30-year period, so there is depth to this study. The reports consider financial losses and generally do not include human fatalities and misery.
Losses in the refinery industry have continued to increase over the last few years, and the causes highlight the aging facilities in this category. A significant number of larger losses (over $10,000,000) have been caused by piping failures or piping leaks leading to fires and/or explosions. Several large losses due to piping failures were due to corrosion issues or using the wrong metallurgy.
As with losses in the refinery category, the number of losses in the petrochemical industry have also continued to increase over the last few years, except for facilities located outside the United States. Outside the U.S., the number of losses in recent years has declined. Losses in recent years have been attributed to piping failures and management system failures.
Modifications Made with Good Intentions, as chemical manufacturers, we must continually modify our facilities to survive in our dynamic industry. Without the appropriate changes, our clever competition or our government regulators will surely drive us out of business. The goal of these modifications may be to increase production, to compensate for unavailable equipment, to add storage capacity, to improve yields, to reduce costs, to enhance safety, or to reduce pollution potentials. The means to achieve these goals may be changes in piping or equipment, new operating procedures, new operating conditions, changes in material of construction, as well as the process chemical changes in feedstocks, catalyst, fuels, or their method of delivery.
The first series of modifications featured in this chapter were all motivated by “Good Intentions.” Despite creative ideas and considerable effort, these modifications failed because no one took the time to examine and expose their weaknesses. These undetected weaknesses caused undesired side effects.
In late 1991 A Tank Truck Catastrophically Fails collapsed as it was unloading a product from a nearby plant (see Figure 2–1). The 6,300-gallon (24,000 L) tank on the trailer, which had a name-plate design pressure of 30 psig (2.0 bar), appeared to be very well maintained and in excellent condition prior to the accident. The assistant trucking terminal manager described the ruined equipment as the worst tank truck collapse that he had witnessed in his 25 years of trucking.
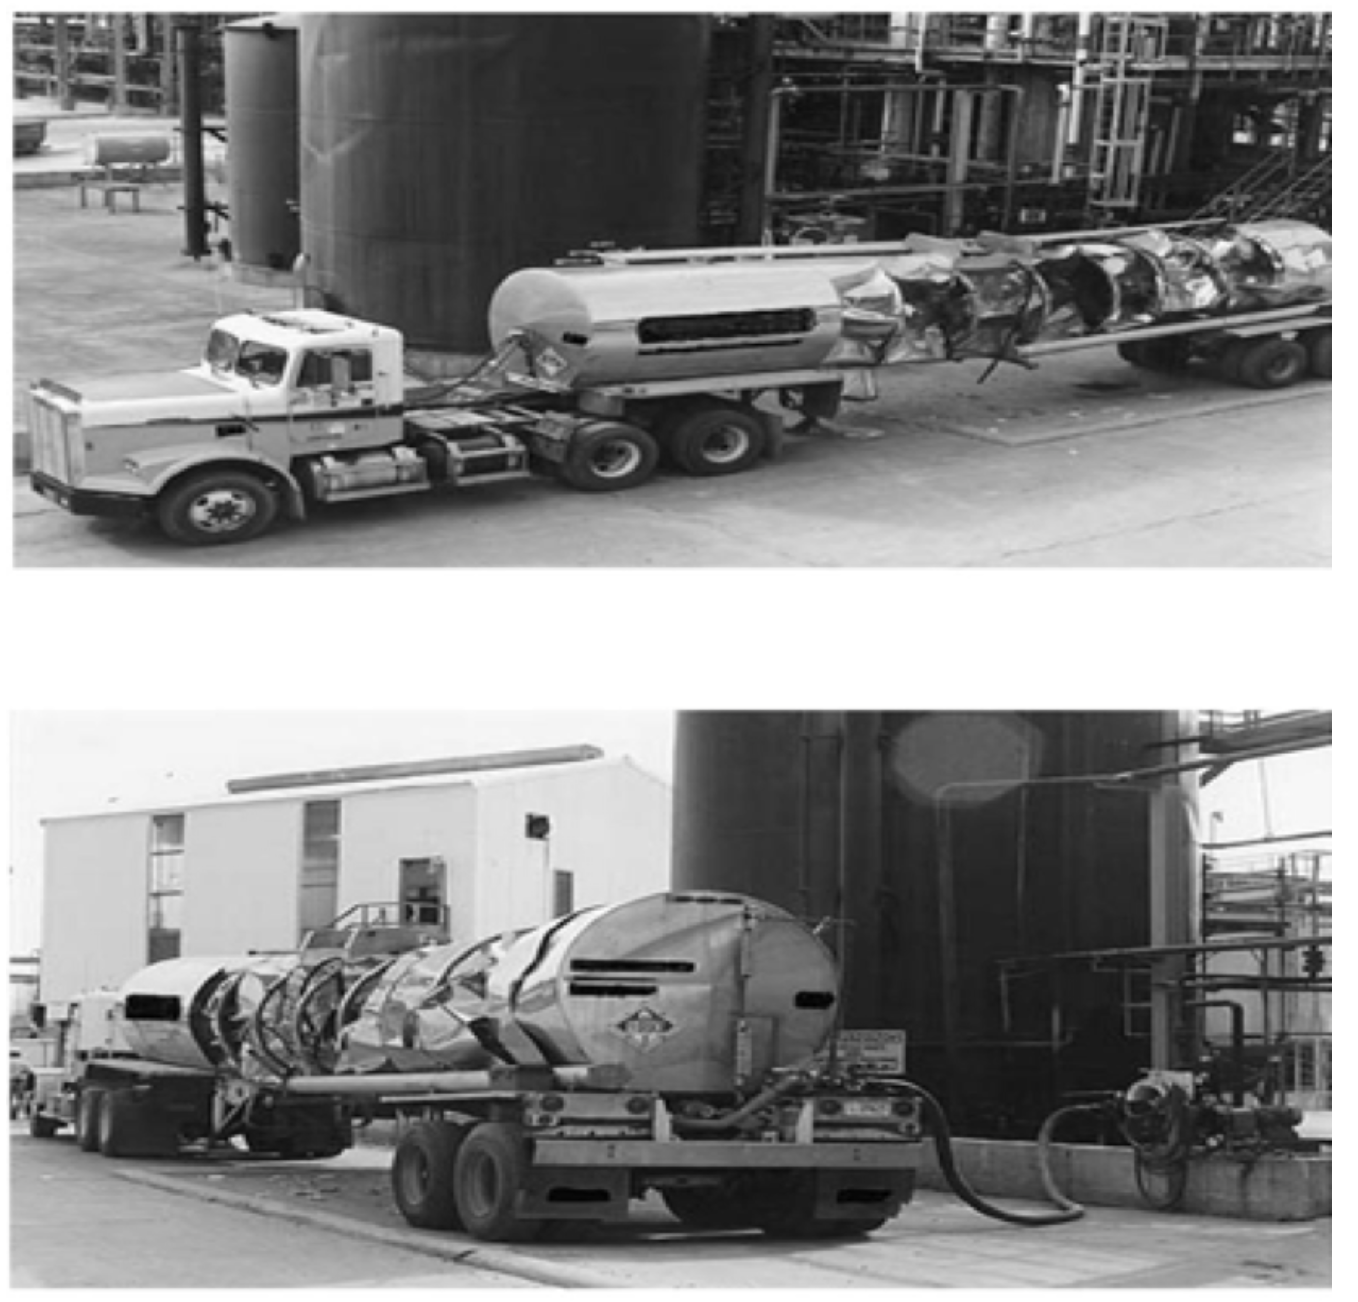
This case history of the tank truck collapse has been reproduced with the permission of the American Institute of Chemical Engineers. Copyright © 1993. It first appeared in “Don’t Become Another Victim of Vacuum,” Chemical Engineering Progress, 1993.
Investigators started reviewing the situation just an hour or so after the incident. The small investigating team learned that the truck arrived about 9:00 A.M. and was set up for unloading about 9:15 A.M. The chemical process operator connected a 3-inch (7.6 cm) unloading hose to the truck and to the plant’s unloading pump Next, she connected a 3/4-inch (1.9 cm) nitrogen hose from the supply station to a manifold that was just forward of the rear wheels on the trailer. Someone modified the truck’s nitrogen padding system and constructed a manifold on the truck that allowed the nitrogen hose connection to be made without climbing the ladder on the truck’s tank. It was just a manifold of 30 ft. or less of half-inch tubing. Probably, the individual that created and fabricated this tubing arrangement assumed he was making it easier for the truck driver.
The plant operator opened the nitrogen valves that were both upstream and downstream of the plant’s nitrogen pressure regulator to pad the truck. The truck manifold that was in front the right rear wheels contained a pressure gauge that read the expected 20 psig (1.36 bar). The operator opened the proper liquid delivery valves, started the unloading pump, and left to handle other chores. The driver stayed with the truck, as was the normal procedure.
At this point the unloading activity appeared normal (see Figure 2–3). In less than an hour, the truck driver checked the sight glass on the truck and informed the control room that the truck was empty. The busy operator passed by and observed that the unloading hose was still vibrating, indicating to her that the tank truck was not quite empty.
About 10:05 A.M., people in the area reported hearing a loud rumble noise and several employees gathered to witness the catastrophic collapse of the tank truck (see Figures 2–4 and 2–5). There were no injuries, no leaks of hazardous materials, and no damage to the plant receiving the feed stock.
Engineers determined that a nitrogen valve was opened to the hose connected to the tank trailer manifold. The nitrogen gas never entered because there was a closed valve atop the tank.
It seems the truck driver misunderstood the recent nitrogen supply piping modifications, the open and closed positions on this oval handle ball valve.
Investigators observed a device that appeared to be a combination safety relief valve and a vacuum breaker. The information on this chrome-topped instrument read, “Press 26,700
Bio:
Dr. Bill Pomfret of Safety Projects International Inc who has a training platform, said, “It’s important to clarify that deskless workers aren’t after any old training. Summoning teams to a white-walled room to digest endless slides no longer cuts it. Mobile learning is quickly becoming the most accessible way to get training out to those in the field or working remotely. For training to be a successful retention and recruitment tool, it needs to be an experience learner will enjoy and be in sync with today’s digital habits.”
Every relationship is a social contract between one or more people. Each person is responsible for the functioning of the team. In our society, the onus is on the leader. It is time that employees learnt to be responsible for their actions or inaction, as well. And this takes a leader to encourage them to work and behave at a higher level. Helping employees understand that they also need to be accountable, visible and communicate what’s going on.