 Overview
The ability to effectively respond to and manage the consequences of an event in a timely manner is essential to ensure an organization’s survivability in today’s fast paced business environment. With the emergence of new threats, such as cyber-terrorism and bio-terrorism; and the increasing exposure of companies to traditional threats such as, fraud, systems failure, fire, explosions, spills, natural disasters, etc. an “integrated” approach to Business Continuity Planning is essential.
The “integrated” approach, as presented in this article, is based on the concept of graceful degradation and agile restoration. “Graceful degradation” refers to the ability of an organization to identify the event, classify it into a level of severity, determine its consequences, establish minimal stable functionality, devolve to the most robust less functional configuration available and to begin to direct initial efforts for rapid restoration of services in a timely fashion.
Hazard, Threat, Risk, Vulnerability and Consequence Analysis
Most organizations employ a business impact assessment as the initial step to developing their business continuity plan. The following matrix summarizes the typical matrix of events that are assessed.
Risks/Threats/Hazards/Vulnerabilities (RTHV)Potential Events |
Probability(H,M,L) |
Impact
(H,M,L) |
Effect
(LT, ST) |
Bomb Threat |
|||
Bomb Event |
|||
| Customer Injury on Premises | |||
| Data Entry Threat/Employee Error | |||
| Disruption of Courier/Mail Delivery Service | |||
| Earthquake | |||
| Executive Succession | |||
| Explosion | |||
| Fire | |||
| Fraud/Embezzlement | |||
| Health Event (Employee Life Safety) | |||
| Heating/Cooling Failure | |||
| Hurricane | |||
| Kidnapping/Extortion | |||
| Lightning | |||
| Loss of Critical Personnel | |||
| Medical Event – Public Health Related | |||
| Natural Gas Leak/Carbon Monoxide | |||
| Pandemic | |||
| Power Failure | |||
| Robbery/Assault | |||
| Severe Weather Conditions | |||
| Snow/Ice | |||
| Software Failure/Virus | |||
| Tampering with Sensitive Data | |||
| Telecommunications Failure | |||
| Terrorist Act | |||
| Tornado/Wind Damage | |||
| Unauthorized Access/Vandalism | |||
| Water Damage/Rain Storms | |||
| Weapons of Mass Disruption (Chemical/Biological) | |||
| Weapons of Mass Destruction (WMD) | |||
| Workplace Violence | |||
| Additional RTHV not listed here |
Additional RTHV listed generally do not account for external vulnerabilities that may remain unidentified by the organization until an event occurs and they are affected by it.
Traditional analysis such as that performed at the initiation of the business continuity plan development is recognized as necessary to develop a baseline of information. However, it should also be recognized as having certain limitations:
- Pre-Event – Best guess as to what could occur
- Static – Best guess based on available facts and models
Traditional analysis creates undecidability due to the inability to predict all behavior in a dynamic environment. Therefore one should adopt an Active Analysis methodology, such as that developed by Logical Management Systems, Corp. (LMS). LMS’ methodology is based on the U.S. Military’s “Joint Special Operations Targeting and Mission Planning Procedures” (JP 3-05.5 10 august 1993). It is detailed herein.
The advantages that can be realized by adopting this methodology and maintaining an active analysis process are:
- Uses Static Analysis as a basis
- Touchpoint complexity factors
- Dynamic – based on creating a mosaic
- Time Factors (Time Critical, Time Sensitive and Time Dependent) act as drivers
Termed “Futureproofing” by LMS the active analysis process is designed to create a mosaic that enhances decision making by identifying behavior patterns in a dynamic environment.
Active analysis can be subdivided into three categories of possible threats/occurrences that could befall an organization. Dr. Ian Mitroff refers to the three categories as Natural Accidents, Normal Accidents and Abnormal Accidents. I have renamed them and to differentiate the three aspects of each. That is, the threat, the actual occurrence and the consequence of the occurrence.
- Natural Threats/Occurrences/Consequences consisting of such things as drought, floods, tornadoes, earthquakes, fires and other naturally occurring phenomena.
- Normal Threats/Occurrences/Consequences consisting of such things as Economic Disasters, such as:
- Recessions
- Stock Market DownturnsRating Agency Downgrade, etc.
- Personnel Disasters, such as:
- Strikes
- Workplace Violence
- Vandalism
- Employee Fraud, etc.
- Physical Disasters, such as:
- Industrial Accidents
- Supply Chain
- Value Chain
- Product Failure
- Fires
- Environmental
- Health & Safety
- Abnormal Threats/Occurrences/Consequences consisting of Criminal Disasters, such as:
- Product Tampering
- Terrorism
- Kidnapping & Hostages, etc.
- Information Disasters, such as:
- Theft of Proprietary Information
- Hacking, Data Tampering
- Cyber Attacks, etc.
- Reputation Disasters, such as:
- Rumors
- Regulatory Issues
- Litigation
- Product Liability
- Media Investigations
- Internet Reputation, etc.
Please note Abnormal Threats/Occurrences/Consequences are becoming more of the norm than abnormal as we see the normalization of threats such as hacking and data tampering.
Five key assumptions were used as a basis to for the developmental framework of the “Futureproofing” methodology. These are:
- Assumption # 1: The modern business organization represents a complex system operating within multiple networks
- Assumption # 2: There are many layers of complexity within an organization and its “Value Chain”
- Assumption # 3: Due to complexity, active analysis of the potential consequences of disruptive events is critical
- Assumption # 4: Actions in response to disruptive events needs to be coordinated
- Assumption # 5: Resources and skill sets are key issues
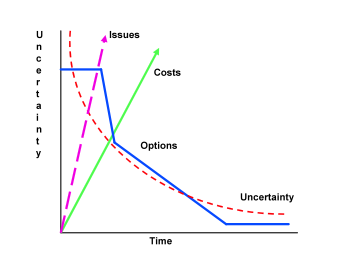
Based on the above assumptions and the results of the baseline analysis (static analysis), one realizes that the timely identification, classification, communication and response, management and recovery from a disruptive event are critical. As depicted in the graphic on the next page over time uncertainty will decrease, as will available options for response and recovery.
This is contrasted with increasing numbers of issues and higher and higher costs associated with response and recovery efforts. As such, an organization should seek to continually analyze situations so as to develop a clear picture of the current state of the business system network. Referred to as “Data Fusion – Constructing a Mosaic” by LMS; this is a process of getting enough bits and pieces of information in place in order to transform seeming chaos into recognizable patterns upon which decisions can be made.
The strategy for “graceful degradation and agile restoration” is depicted in the graphic below.
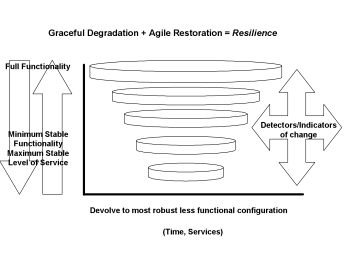
The top ring represents the business system and its network in full functionality. The smaller rings represent successive levels of “graceful degradation” that the business system and its network will undergo until reaching a level of minimum functionality. When the business system and its network reaches the state of minimum functionality, the organization can begin to conduct a campaign of “agile restoration” until it achieves a state of full functionality and a return to normal operations. One key to the process of “graceful degradation and agile restoration” is having a classification system for the Business Continuity Plan. As the graphic below depicts, “detectors and indicators of change” are employed to facilitate the constant analysis of the state of the business system and its complex “value chain” network. The “detectors and indicators of change” provide the early warning basis for event classification at the lowest (least severe) levels.
Business Impacts Matrix
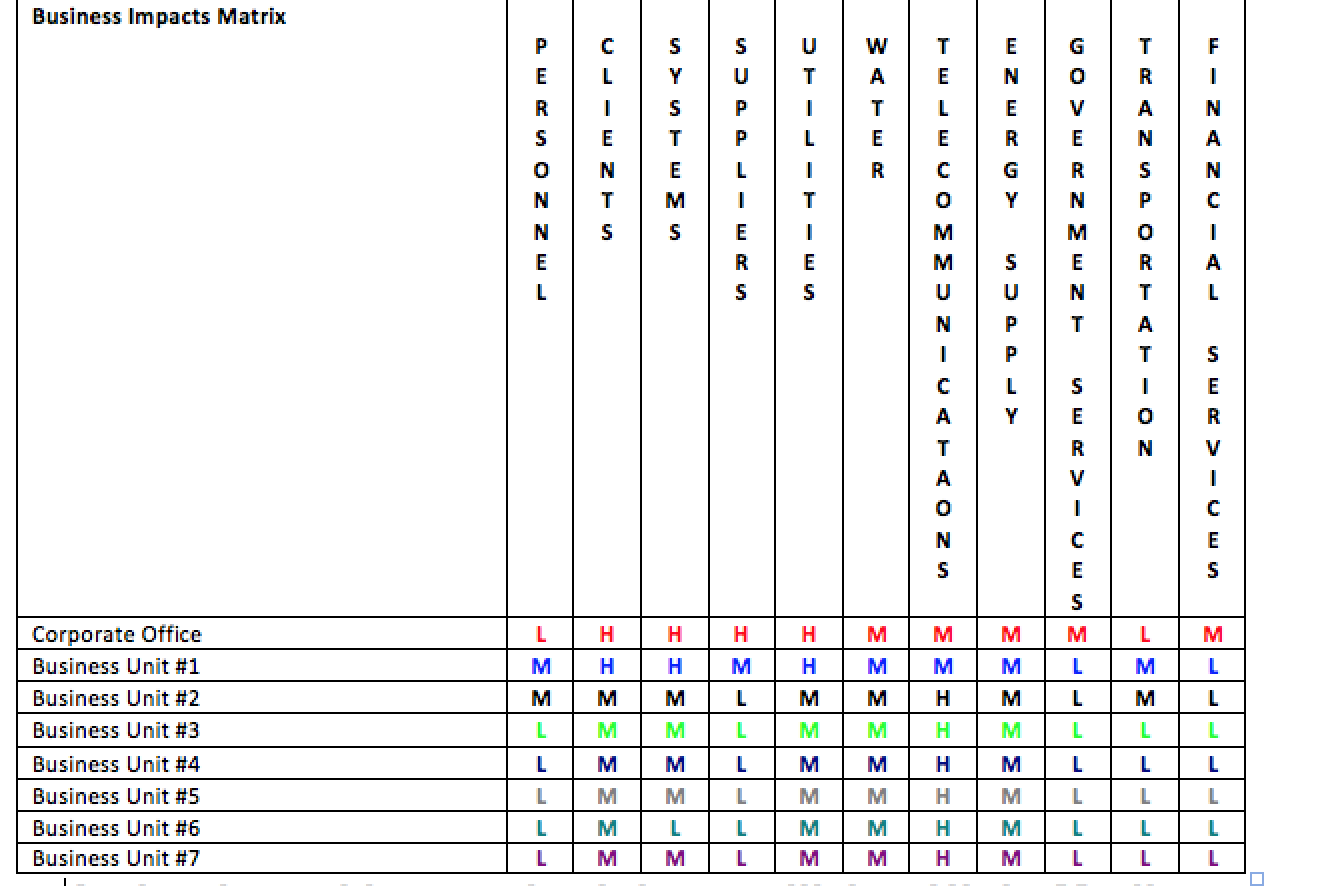
Depicted below is an example of a business impact matrix that can be developed as part of a worksheet for active analysis. The matrix represents the critical elements within the business system’s network that, if interdicted, would pose a threat to the business system’s ability to conduct normal business operations. The elements considered are as follows:
- Personnel – consisting of management, employees, stakeholders, suppliers, providers, partners, contract/vendor entities, etc.
- Clients – consisting of current, new and former customers.
- Systems – consisting of internal operating systems and critical external infrastructures.
- Suppliers – consisting of providers of essential business logistics.
- Utilities – consisting of electric, gas, water and telephone service providers
- Water – consisting of water treatment and other water support systems.
- Telecommunications – consisting of internal telecommunications systems linked to external telecommunications providers.
- Energy Supply – consisting of energy delivery systems and energy support systems.
- Government Services – consisting of emergency management, police, fire, emergency medical, Federal, State and local government bodies and political support systems.
- Transportation – consisting of air, land and water transportation system and support systems.
- Financial Services – consisting of financial markets, investments, statutory deposit requirements and cash flow systems.
Each of these elements is periodically rated as part of the Active Analysis system to determine the potential impact of loss or degradation on the business system and its network.
A simple ranking methodology utilizing High, Medium and Low (H, M, L,) designations can provide a basis for determining situational loss or degradation effects. The matrix below provides an example of such an analysis.
Active Analysis Methodology
The following section is a discussion of the “Active Analysis” system employed by Logical Management Systems, Corp. Based on the LMSCARVERTM Analysis Elements, the system provides a flexible framework for the continuous accumulation and assessment of “detectors and indicators” of change. As defined below these are the key elements:
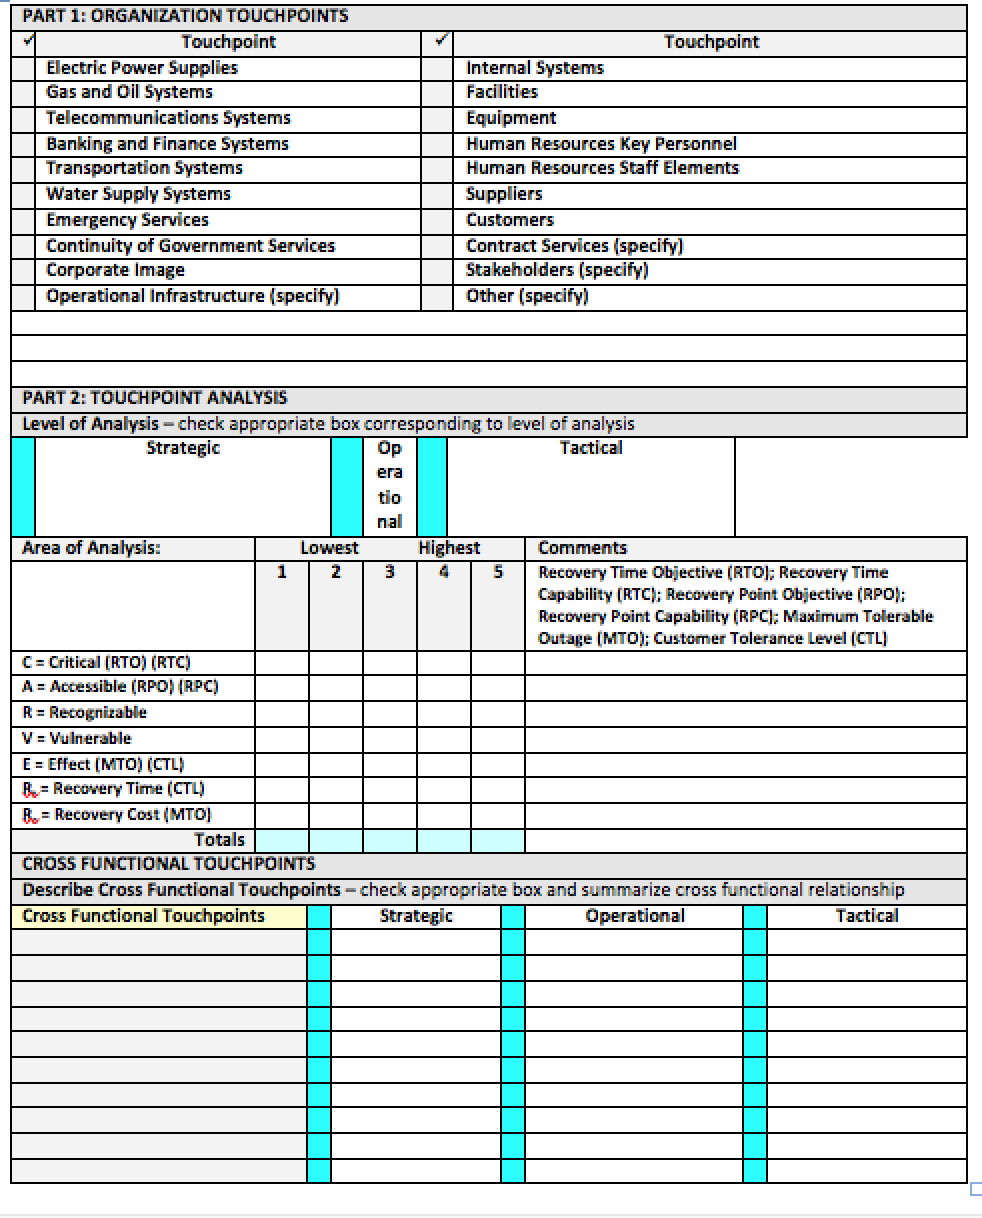
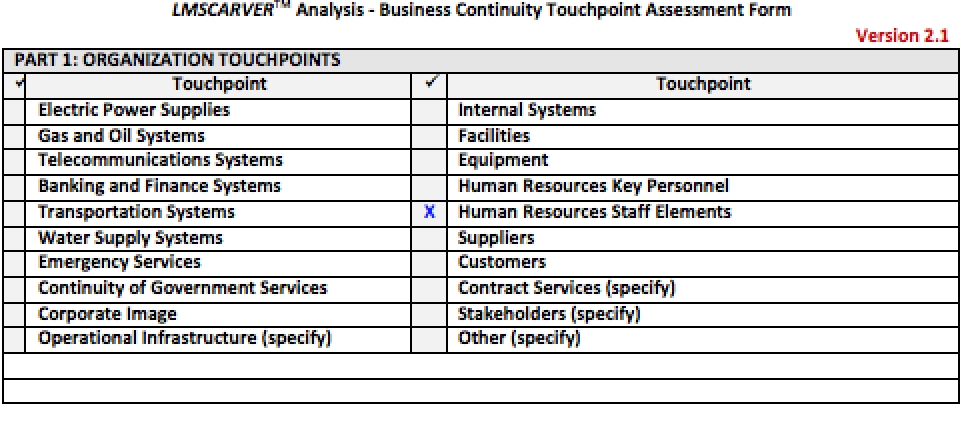
Directions: This form is designed to facilitate the evaluation of risks, threats, hazards and vulnerabilities for your organization and to determine the consequences of Touchpoint degradation to your organization. Use a separate sheet for each Touchpoint (Part 1).
Part 1: Complete Part 1 by choosing a Touchpoint for analysis (check appropriate box). This now becomes the Essential Element of Analysis (EEA) Touchpoint for the assessment grouping.
Part 2: Complete Part 2 by inserting a component that makes up a measure of effectiveness for the EEA Touchpoint into the Area of Analysis box. Rank each sub-element using the number scale 1 – 5, where 1 is the lowest importance and 5 is the highest importance. Provide comments as to why you rated the sub-element as you did.
For example, if you have chosen the EEA Touchpoint Electric Power Supplies, you would have sub-elements consisting of source for your location, generators, local utility, etc.
Once a sub-element is selected insert it into the space provided, complete the LMSCARVERTM Touchpoint Analysis, ranking each sub-element using the numeric rating system. If you choose to only perform a top level analysis, you will check the appropriate box in Part 1 and fill in the same selection name to Part 2, proceeding to complete the analysis per the above guidance. Regardless of the level of analysis that you have chosen, you must address the RTO, RPO and MTO elements in the comments section of Part 2.
LMSCARVERTM Analysis Elements
- “Critical”: Determine the criticality of the service, product, etc. that your organization utilizes. This may be supplied via your organization’s value chain or an external entity.
- “Accessible”: Determine “Accessibility” by ranking the element as to the ease with which one can access the element. One needs to assess the accessibility to the item, the accessibility to alternative items that can be substituted and the accessibility of the item to disruption.
- “Recognizable”: Determine how readily recognizable the element is.
- “Vulnerable“: Determine the total loss and/or degree of degradation that the organization can sustain.
- “Effect” Determine what impact the loss and/or degradation presents to your organization.
- “Recovery” Determine what your organization’s recovery ability is in terms of time and costs.
- Recovery Time Objective (RTO): Anticipated time to recover operation.
- Recovery Time Capabilities (RTC): Actual capabilities available to accomplish recovery operation
- Recovery Point Objective (RPO): Amount of loss that can be sustained without impact to operation.
- Recovery Point Capabilities (RPC): Actual capabilities that can be utilized for recovery.
- Maximum Tolerable Outage (MTO): Amount of disruption that can be sustained by the operation over time including market share loss. Maximum Tolerable Outage is predicated on how long a customer can be without your service and/or product before they seek alternatives.
- Customer Tolerance Level (CTL) = Customer Tolerance Level can be determined by how many delays, disruptions to service, etc. a customer is willing to put up with before changing (not being a customer anymore).
- Cross Functional Touchpoint: A touchpoint of or relating to two or more functions where a dependency for output and/or input occurs.
Risk, Threat, Hazard, Vulnerability (RTHV): It’s All About the Consequences
Some facts to consider:
- Risk, Threat, Hazard, Vulnerability (RTHV) are not static, they are fluid.
- RTHV probes for weaknesses to exploit.
- RTHV, therefore, can only be temporarily mitigated and never really eliminated.
- Over time RTHV mitigation degrades and loses effectiveness as RTVH mutates, creating new RTHV realities.
- Risk Absorption Capacity: “An organization’s ability to survive the uncertainty of risk realization”.
- Risk Saturation Point: “That point at which an organization’s capacity to absorb risk (either positive or negative) exceeds its capabilities; thereby creating an inability to sustain risk exposure”.
- Risk Deflection: “An organization’s ability to create risk parity through risk buffering to deflect the impact of risk realization”.
- Risk Explosion: “The impact (either positive or negative) on organization’s ability to balance risk realization resulting in greater risk awareness”.
Other factors to consider when conducting the analysis:
Categorizing RTHV into three levels of analysis – strategic, operational and tactical to create clusters that can be assessed to determine the likelihood, impact, velocity, volatility, uncertainties, complexities, and ambiguities (opacity factors).
Note: Nassim Taleb offers the concept of “Antifragility” simply, antifragility is defined as a convex response to a stressor or source of harm (for some range of variation), leading to a positive sensitivity to increase in volatility (or variability, stress, dispersion of outcomes, or uncertainty, what is grouped under the designation “disorder cluster”). Likewise fragility is defined as a concave sensitivity to stressors, leading a negative sensitivity to increase in volatility. The relation between fragility, convexity, and sensitivity to disorder is mathematical, obtained by theorem, not derived from empirical data mining or some historical narrative. It is a priori”. Antifragility refers to systems that increase in capability, resilience, or robustness as a result of mistakes, faults, attacks, or failures.
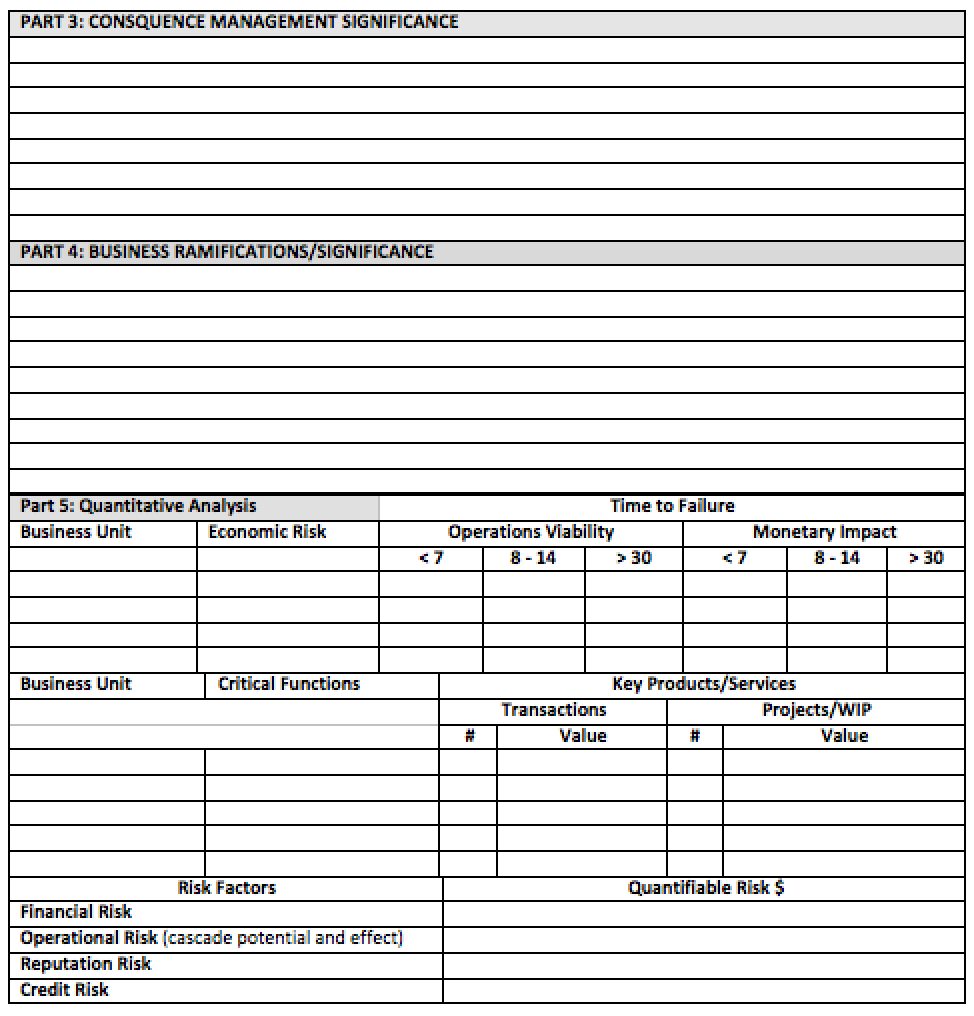
Part 3: Complete Part 3 by filling the consequence management significance to your organization for degradation or total loss of the EEA Touchpoint element and its constituent sub-elements. Give some thought to what the consequences would be if you were unable to access or utilize the EEA Touchpoint or sub-element for a period of time. What duration increments would you consider as time critical, time sensitive and time dependent? How does your organization deal with disruption?
Part 4: Complete Part 4 by defining the business ramifications/significance to your organization for degradation or total loss of the EEA Touchpoint element and its constituent sub-elements. Give some thought to what the business significance would be if you were unable to access or utilize the EEA Touchpoint or sub-element.
Part 5: Complete Part 5 by completing the quantitative analysis.
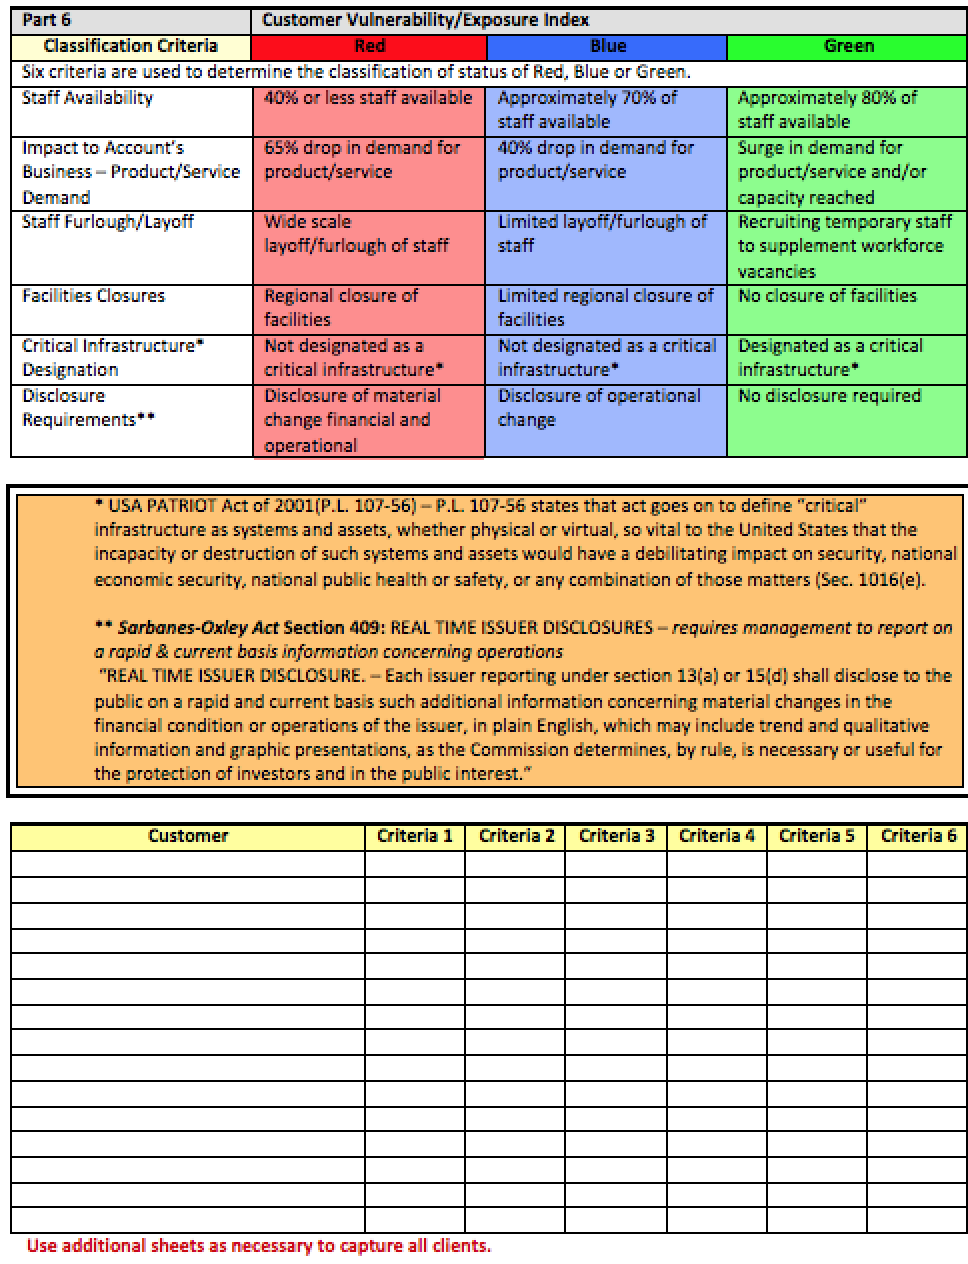
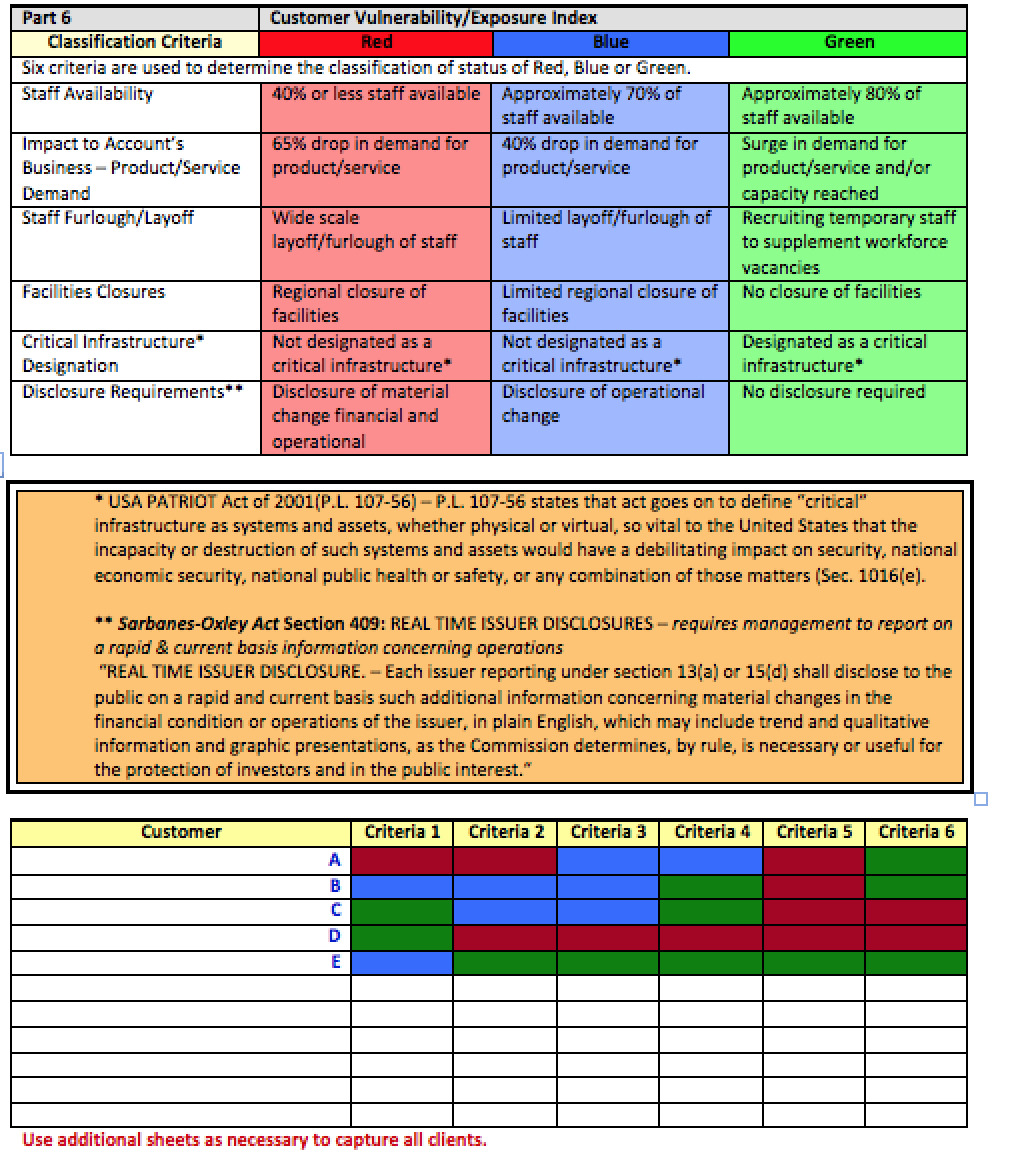
Part 6: Complete Part 6 by assessing the six criteria for customer vulnerability/exposure index and determining the impact to the enterprise of customer disruptions.
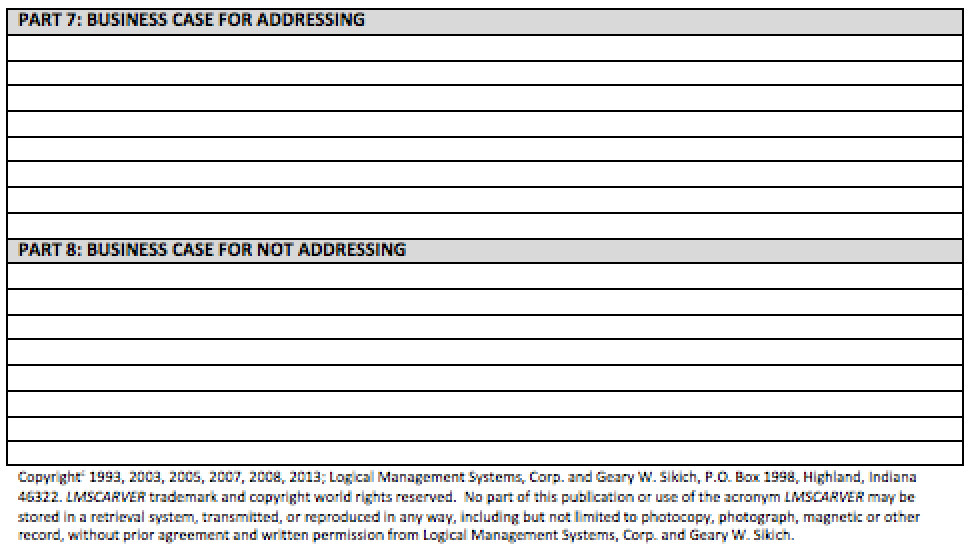
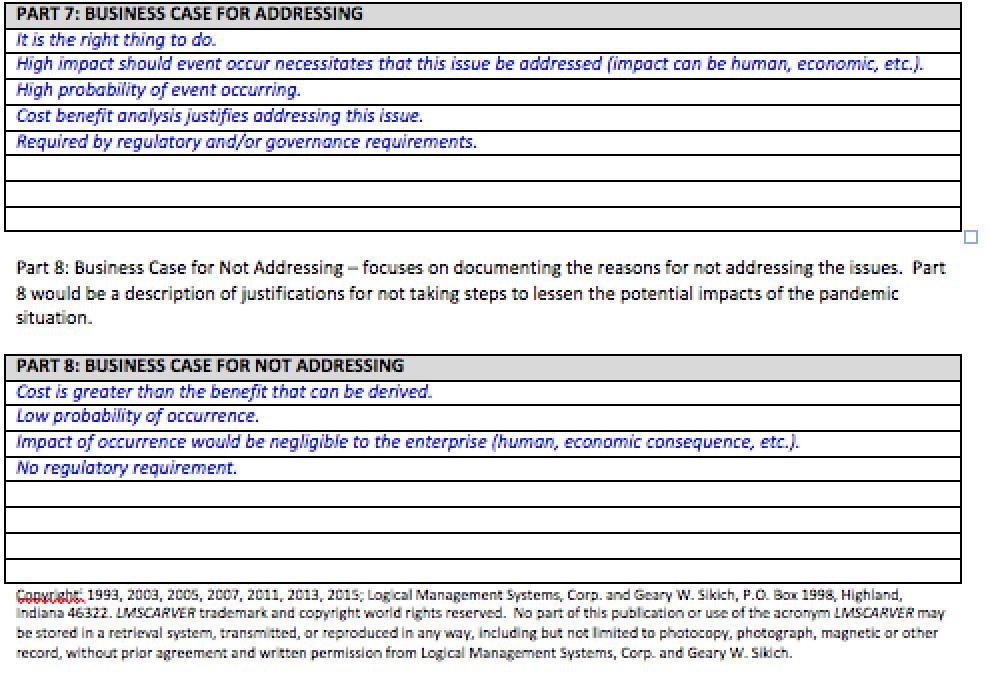
Part 7: Complete Part 7 by establishing and defining the business case for addressing the potential impact to your organization for degradation or total loss of the EEA Touchpoint element and its constituent sub-elements.
Part 8: Complete Part 8 by establishing and defining the business case for not addressing the potential impact to your organization for degradation or total loss of the EEA Touchpoint element and its constituent sub-elements.
If the space available is not sufficient for your write up, attach supplemental pages as necessary.
Now that you have an understanding of the LMSCARVERTM Touchpoint Analysis methodology we can proceed to the example of a completed form. In the example, I begin my analysis by selecting an Organization Touchpoint from the list in Part 1. The flexibility within the LMSCARVERTM Touchpoint Analysis methodology is that I can insert Organization Touchpoints specific to my organization for evaluation. As depicted below, in Part 1: Organization Touchpoints, I have chosen to assess the area of Human Resources Staff Elements. This now becomes my Essential Element of Analysis. As depicted below, I have checked the appropriate box in Part 1 as indicated by the “X” in the box next to the line “Human Resources Staff Elements.”
The next step is to go to Part 2: Touchpoint Analysis and check the appropriate level of analysis that I wish to perform. The LMSCARVERTM Touchpoint Analysis methodology allows you to select three levels – Strategic, Grand Tactical or Tactical. Each level has its own degree of specificity from an analysis standpoint. In this example, Strategic analysis looks at the Human Resources Staff Elements from an enterprise-wide perspective. A Grand Tactical analysis of the Human Resources Staff Elements would look at the operational level, say perhaps a business unit. At the Tactical level of analysis we would look at the department or working group level. The Tactical level is the smallest configuration that exists within the enterprise. As depicted below, I have chosen to address the Strategic level as indicated by the “X” in the appropriate box. Next I complete the Area of Analysis and Comments sections as depicted in the example below.
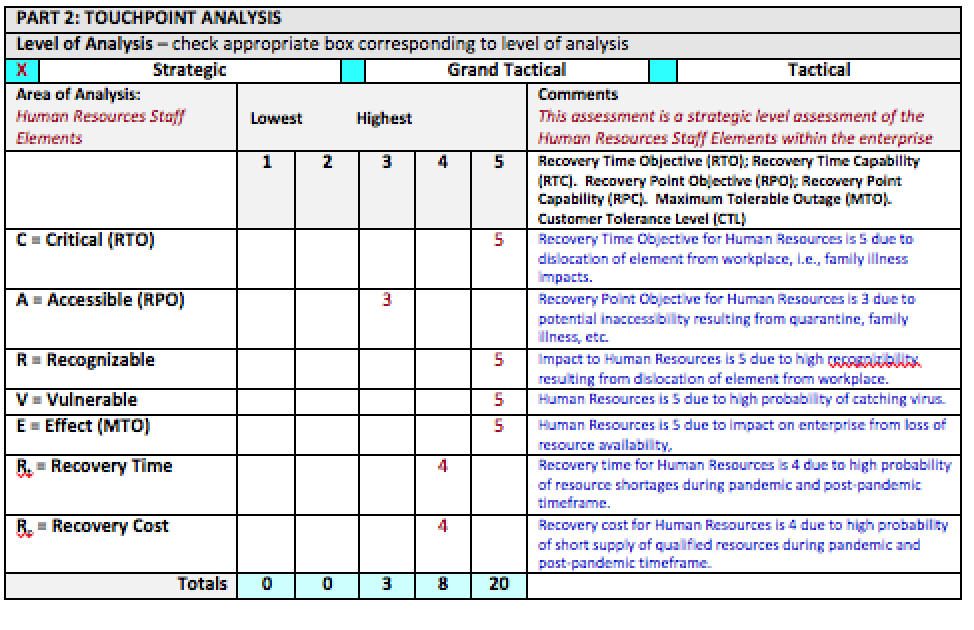
Now I want to complete the CARVERR portion of the analysis by giving a numerical ranking and any clarifying comments as to the number chosen for each of the CARVERR elements. As depicted in the example these would relate to Human Resources for the enterprise as a strategic asset in the context of a pandemic event.
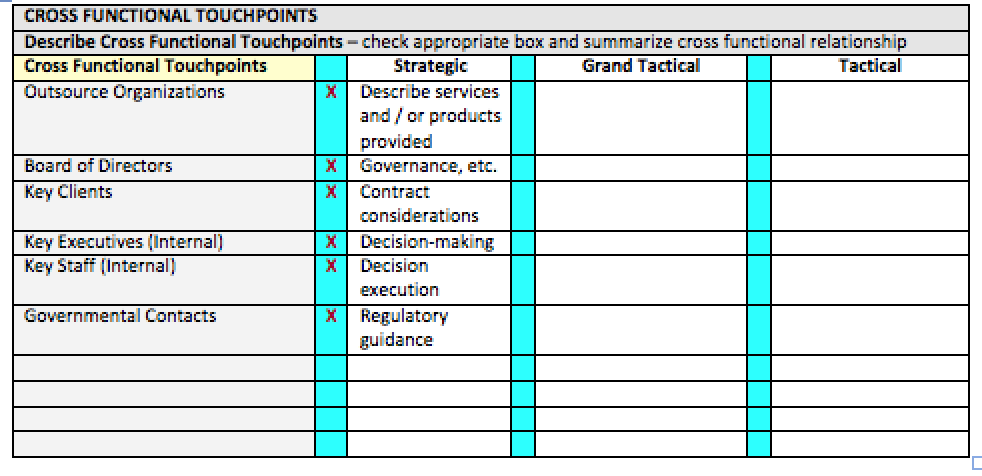
The next portion of the form focuses on the Cross Functional Touchpoints that Human Resources Staff Elements have. Cross Functional Touchpoints are defined in BusinessDictionary.com as – A Group of people with different functional-specialties or multidisciplinary-skills, responsible for carrying out all phases of a program or project from start to finish. This definition can be extrapolated to include non-human cross functional touchpoints, such as the relationship business processes would have. In our example of a Strategic Assessment, Cross Functional Touchpoints are going to be at a higher level than individuals per se. The descriptions can be expanded on to include more detail than in the example if necessary.
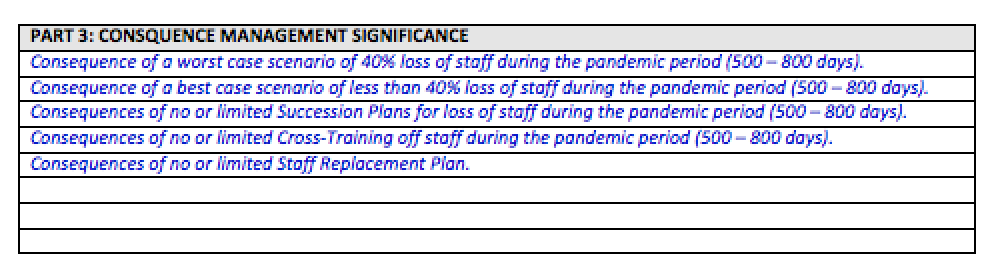
Part 3: Consequence Management Significance, would describe the impact (consequences) that the loss or degradation of Human Resources Staff Element would have on the overall (strategic) focus of the enterprise. In this section you would want to describe in detail the consequences that are of significance to the enterprise from the loss or degradation of the Human Resources Staff Element during a pandemic. This could be broken down to reflect loss of staff over time (500 – 800 days). Consequences of loss as related to impact on business operations over time and consequences of failure to find replacements (temporary or permanent) as it relates to the meeting of strategic goals and objectives. The impact of failure or degradation to meet financial goals and objectives of the enterprise could also be described; again based on time.
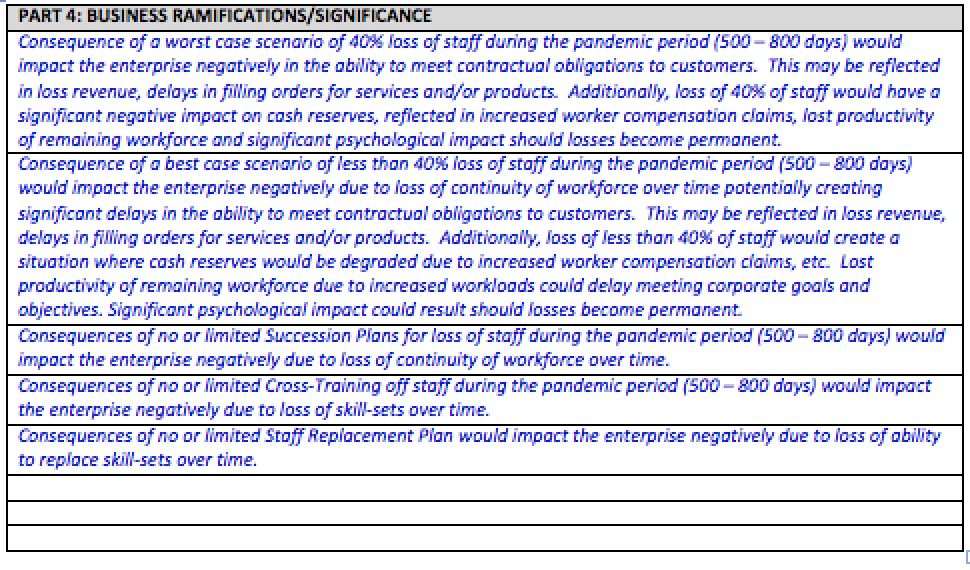
The examples cited above would be addressed in the next part of the assessment. In Part 4: Business Ramifications/Significance, a strategic assessment would focus on the impairment of the enterprise to meet its goals and objectives.
Part 5: Quantitative Analysis focuses on the strategic implications by business unit of the items identified in Part 3 and Part 4.
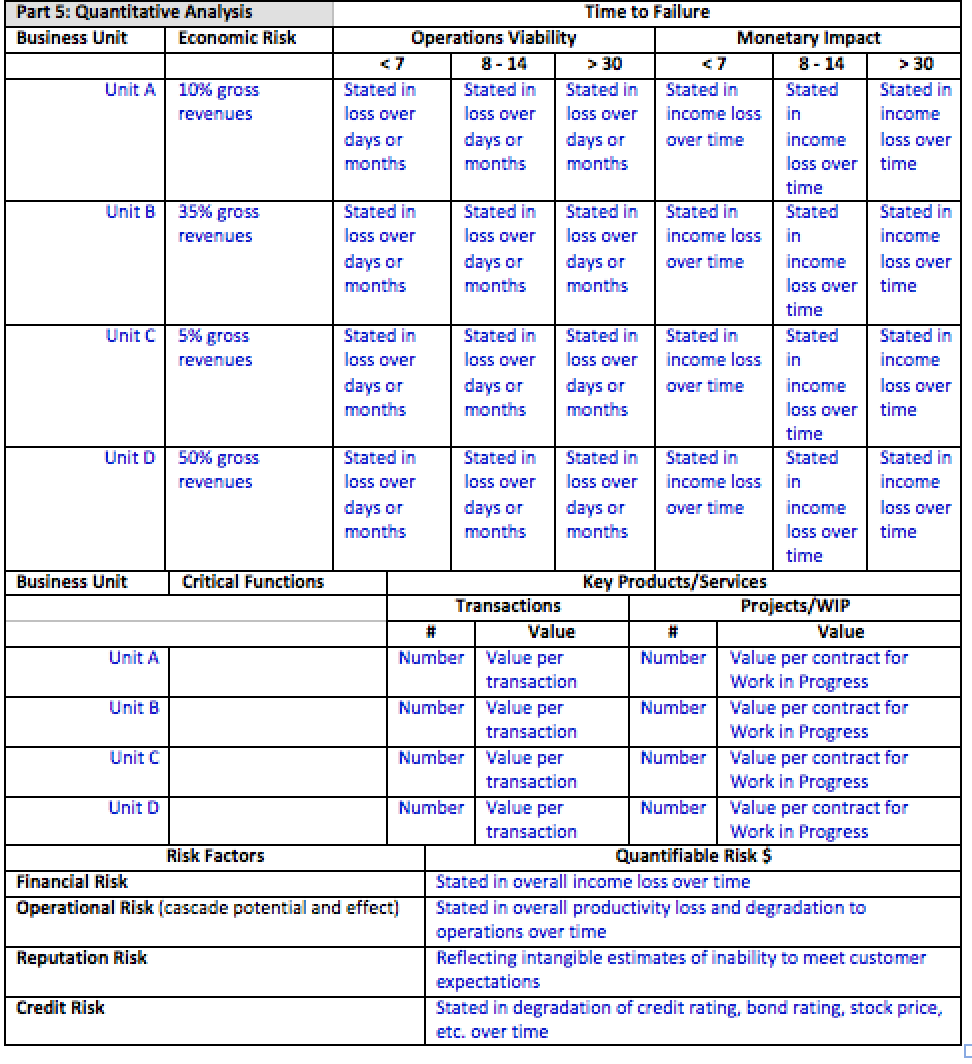
Part 6: Customer Vulnerability/Exposure Index provides an opportunity to assess the potential impact of a disruptive event to your customers. This part focuses on six criteria that I have developed that are reflective of customer vulnerabilities and exposures. Please note, as you are completing this part you would also benefit from doing a similar analysis for your enterprise as it reflects your organization as a customer of others (i.e., your suppliers, vendors, etc.). The benefit of this part is in determining where your organization may experience a downturn in its operations due to a lack of demand for products/services of your customers. This should be an analysis of what your customers provide to the marketplace and how they may be impacted by a pandemic thereby creating a loss of revenue for your organization.
Part 7: Business Case for Addressing – focuses on steps that can be taken to address the impact of loss or degradation to your business operations. Part 7 would be a description of steps that can be accomplished to lessen the potential impacts by preparing plans that can be executed when needed to insulate the organization and/or reduce the overall impact of the pandemic situation.
Conclusion: Seize the Initiative – It Makes Sense
A Chinese proverb states that “Opportunity is always present in the midst of crisis.” Every crisis carries two elements, danger and opportunity. No matter the difficulty of the circumstances, no matter how dangerous the situation… at the heart of each crisis lies a tremendous opportunity. Great blessings lie ahead for the one who knows the secret of finding the opportunity within each crisis.
Today business leaders have the responsibility to protect their organizations by facilitating continuity planning and preparedness efforts. Using their status as “leaders,” senior management and board members can and must deliver the message that survivability depends on being able to find the opportunity within the crisis.
Many people feel that the world has changed as a result of the events that took place on September 11, 2001; that we need to rethink our concepts of continuity and crisis management. Today we cannot merely think about the plannable or plan for the unthinkable, but we must learn to think about the unplannable.
Market research indicates that only a small portion (5%) of businesses today have a viable plan, but virtually 100% now realize they are at risk. Seizing the initiative and getting involved in all the phases of crisis management can mitigate or prevent major losses. Just being able to identify the legal pitfalls for the organization of conducting a crisis management audit: can have positive results.
About the Author
Geary W. Sikich is the author of “It Can’t Happen Here: All Hazards Crisis Management Planning” (Tulsa, Oklahoma: PennWell Books, 1993). His second book, “Emergency Management Planning Handbook” (New York: McGraw-Hill, 1995) is available in English and Spanish-language versions. His third book, “Integrated Business Continuity: Maintaining Resilience in Uncertain Times,” (PennWell 2003) is available on www.Amazon.com. His latest book, “Protecting You Business in a Pandemic,” (Greenwood Publishing) is available on www.Amazon.com. Mr. Sikich is the founder and a principal with Logical Management Systems, Corp. (www.logicalmanagement.com), based near Chicago, IL. He has extensive experience in management consulting in a variety of fields. Sikich consults on a regular basis with companies worldwide on business-continuity and crisis management issues. He has a Bachelor of Science degree in criminology from Indiana State University and Master of Education in counseling and guidance from the University of Texas, El Paso.