 Received a question from a reader this morning that will make a nice tutorial.
A box contains 27 black and 3 red balls. A random sample of 5 balls is drawn without replacement. What is the probability that the sample contains one red ball?
So here’s my thinking and two ways to solve this problem. Instead of red and black balls in an urn type problem, which is pretty abstract, let’s say we know 3 bad parts are in a bin of 30 total parts.
We need five parts to build a system and if one is bad, we have to repair the system, which has a cost.
Or, should we sort and test each part which also has a cost and takes time to accomplish?
The details will be in the cost of inspections and the cost of a system repair, yet we also need to know the probability of building a system with one bad part out of the five needed.
Probability and Combinations
My first thought in solving the problem was the nature of the sampling, without replacement. This is realistic in that we need five parts for the build, so selecting one and putting it back in the bin would serve no purpose.
Without replacement means that the number of parts available for selection changes and depending on if a good or bad (black or red) part is selected the number remaining changes respectively.
The other note to consider is the order of the final parts doesn’t matter, so thought about using combinations. Combinations provide a quick way to count the number of collections possible for a given situation. For example, if drawing 5 parts from the bin, there are 30 draw 5 different unique sets of results.
The idea of combinations led me to consider using the hypergeometric distribution to sort out the probability. There are four bits of information, 30 total parts, 27 good parts, 3 bad parts, drawing 5 parts. More on that later.
Another approach is to map out the array of possibilities using a branching diagram. It’s a brute force approach and not always convenient. Let’s explore that first.
Mapping Out All Possible Outcomes
Keep in mind that for this problem there are a finite number of potential outcomes, and the sum of all those possible outcomes must equal one. We are interested in one specific subset of outcomes, those with one, and only one, bad (red) part included in the set of parts.
Here’s my map (I stopped at three parts as it fit nicely on the paper I was using and illustrates the approach).
The first selected part is either good (black) or bad (red). There is a 3 in 30 chance of selecting a bad part and a 27 in 30 chance of selecting a good part. This stands to reason as there are just a few bad parts and many more good parts in the bin.
Let’s follow the path where we have already selected one bad part, as we need to select two good parts to have a result with only one bad part of the three selected.
The second draw is from a bin with 29 parts, and assuming we are selecting the parts where each part has an equal chance of being selected at random (not always a good assumption, btw), we have a 27 out of 29 chance of selecting a good part. All 27 good parts are still in the bin after the first selection.
The third draw is from a bin with 28 parts. And, there is one less good part, so we have a 26 in 28 chance of selecting a good part.
Adding two more selections just continues the map. When all the bad parts have been selected there are none left in the bin so there is no chance of selecting a bad part at that point. You can see the process here and with five draws the map just gets bigger, not more complex.
The probability of the possible outcome where we select a bad part followed by two good parts is the product of the probability for each selection along the path. 3/30 x 27/29 x 26/28 = 0.08645
There are three potential ways to have just one bad part in a set of three: Select the bad part first, or second, or third, and good parts otherwise. Thus, we calculate the probability of those three paths and add them to find the probability of having just one bad part in a collection of three parts.
If my math is correct there is a 25.935% chance of having one bad part out of three selected from a bin containing 3 bad parts and 27 good parts. In other words, if we build the system there is about a 26% chance we will have to conduct a repair.
One more note, to check the math and mapping, the sum of all the potential paths should equal one.
The cost of the repair times 0.26 is the net cost considering the risk of getting one bad one. To fully expand this problem we may want to know the chance of getting at least (one, two, or three) bad parts in the selection, which would be a bit higher than having just one bad part.
Hypergeometric Approach
Keep in mind that a probability is a ratio of some event or set of outcomes and the tally of all the possible outcomes. For example, with a coin flip, we count two possible outcomes, heads or tails. The chance of one coin toss resulting in a head is 1 divided by 2 or 50% (assuming a fair coin and it doesn’t land on its edge or falls into a crack in the floor never to be seen again…)
The hypergeometric distribution uses combination calculations of the counts of good parts, bad parts, and total combinations.
Continuing with the example of drawing three parts (not five) from the bin we have the following known bits of information:
- 30 total parts in the bin (N)
- 3 is the sample selected without replacement from the bin (n)
- We are interested in the probability of finding 1 bad part in the set (x)
- There are 3 bad parts (m)
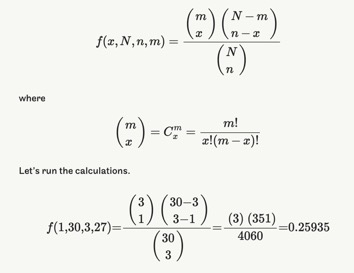
Same result, all good.
BTW: I used the Google spreadsheet function combin(x,y) to do the combination calculations rather than resorting to my calculator and factorials.
Summary
Now just follow the above example for a selection of 5 parts. A 5 step map or change from a sample selected from 3 to 5 (n) in the hypergeometric approach.
With a 26% chance of having one bad part out of three installed into a system the repair of the system has be pretty simple and quick and the inspection process for parts before assembly pretty expensive and time consuming before it makes sense to just build and hope you got all good parts.
Bio:
Fred Schenkelberg is an experienced reliability engineering and management consultant with his firm FMS Reliability. His passion is working with teams to create cost-effective reliability programs that solve problems, create durable and reliable products, increase customer satisfaction, and reduce warranty costs. If you enjoyed this articles consider subscribing to the ongoing series at Accendo Reliability.