 In Part Two of this article on predicting the future with science, we look at the tool from Statistical Process Control that helps us understand behaviour patterns in our processes so we can make more informed decisions.
WHEN IS A PROCESS PREDICTABLE
We say that a process is “predictable” when it is in a state of “statistical control”. This means when we measure the process and put the data on a control chart, it oscillates between its natural limits (and complies with some other minor rules).
When a process is in this state, we say it is “predictable” because, if nothing changes, it will continue to oscillate in a predictable manner, between its limits.
IF or WHEN it starts to deviate from the state of statistical stability (its oscillation goes beyond the limits), only at that moment can we say that we detect an “anomaly”, or an extra-ordinary event. Unfortunately, it is only after the fact that we can say that an extra-ordinary event has happened. But at least we have a criterion to sift it out and recognize it as such.
MISLEADING CHARTS
Below is an example of a “run chart” of a process. It represents the arrival time at the office of an “average” person.
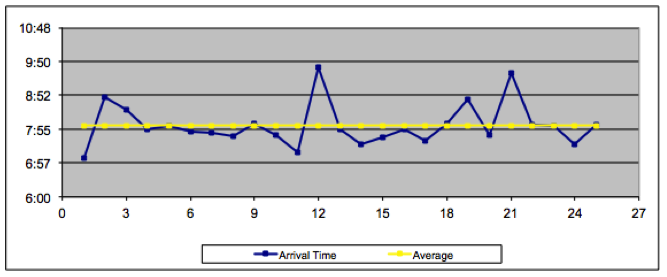 The yellow line is the statistical average of the series of data, and the arrival time oscillates between, more or less, 7.00am and 9.50 am. It is a considerably wide range.
If we just look at the series of points, we are led to think that day number12 and day number 22 are “anomalies” (they are far from the average and they make it look as though “Mr. Average” is late).
This interpretation is a typical mistake we make when we look just at the numbers, without any reference system to give us a meaningful context.
USEFUL CHARTS
Let’s look at this process in a less naive way. A reference system is provided by Statistical Process Control (SPC) so now we have some context. If we calculate the natural limits of oscillation and we draw them on the chart, this is the result:
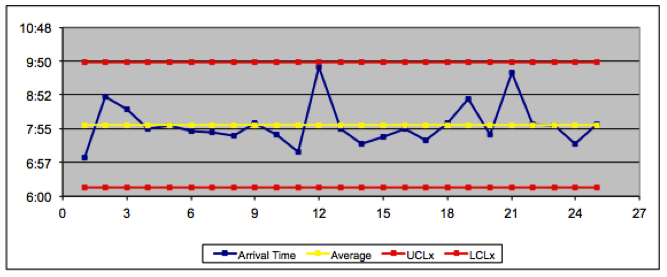
The process of “Mr. Average goes to the office” is in fact IN CONTROL. It oscillates between its natural limits (the limits are CALCULATED, not imposed arbitrarily).
The word “predictability” now takes on a different meaning. The process is in control (it is predictable) because it oscillates between the limits, and we can say it will continue to oscillate between them until “something special” happens.
Let’s look at another process; this is the process of “Mr. Average’s colleague going to work”. The graphic below shows what that process looks like on a simple “run chart”:
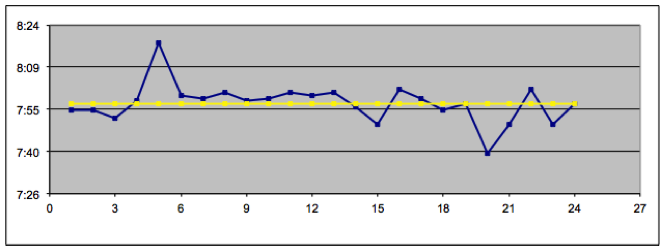
The yellow line is the statistical average of the series of data, and the arrival time oscillates between, more or less, 7.40am and 8.20am. Compared with Mr. Average’s arrival time the range is much more narrow, and it looks more “reliable”.
Unfortunately, we cannot rely on impressions to know that everything is all right. Look what happens when we add the natural limits of oscillation:
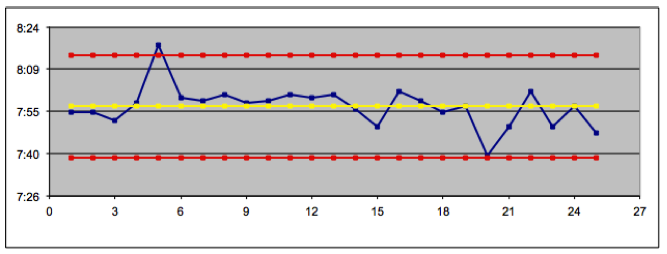
The process is “out of control”, which means (according to SPC) that the process is unpredictable.
The implication of this statement is the following. Suppose that the boss of the two employees has to organize a meeting in the morning. He will know that, according to the two different behaviors, Mr. Average is likely to be present at any time after 9.50 am. On the other hand, his colleague’s presence would be uncertain because of his unpredictability.
UNDERSTANDING REALITY
What is the meaning of all this? People may claim to foresee upcoming extra-ordinary events, and we do not understand how they possess this vision, i.e. this ability to predict or make forecasts. Giving names to the events such as “Black Swans” doesn’t help us very much in understanding reality. For example, we could have used the name “Black Swans” for events 12 and 22 on the run chart of Mr. Average.
What we do know, instead, is that it is impossible to predict “extra-ordinary” events. What we can do is distinguish “noise” from “signal”. This means there is no need to base important choices on our gut feel when we can base them on simple statistics applied to reality. We can avoid crying wolf unnecessarily.
It may be a dream, but if we apply a little science and a modicum of intelligence to the understanding of the world, our future can be so much better.
How to Scientifically Predict the Future (well, at least for your processes)
Our programs on Statistical Process Control:
Start Making Sense: Intro to Statistical Process Control
Further reading from us:
Why Management Decisions Must Consider Variation
Managing Variation: Why Entropy Matters
Bio:
Dr. Giovanni Siepe is a Partner of Intelligent Management Inc. He is a physics graduate with a research thesis on the General Theory of Relativity. Dr. Siepe has over twenty years experience in the management of Industry. His special area of interest in The Decalogue methodology is Statistical Process Control. He has worked extensively on simulations and has gained over the years a profound understanding of the management of variation for the successful running of operations: from replenishment to manufacturing to sales.