 Not all risks the same. Some are minor with little consequence, while others are not. Every organization or reliability program facings a plethora of risks and being able to communicate the range of identified risks is helped by using a risk matrix.
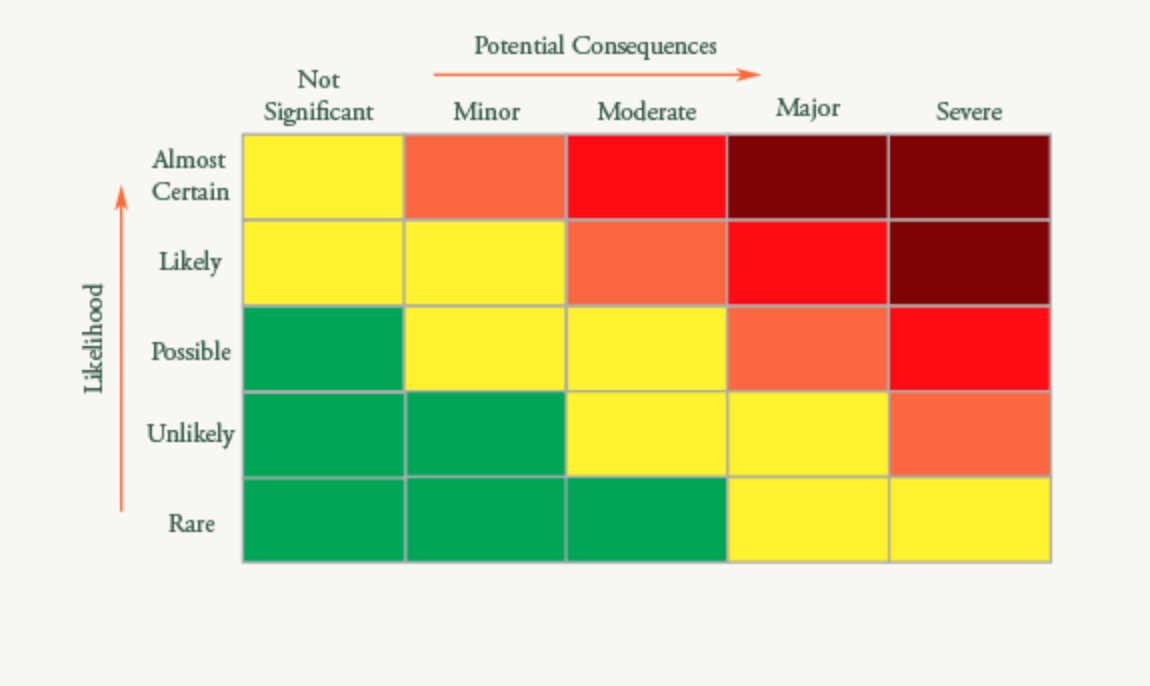
The risk matrix is a simple two-dimensional grid that lays out on one access the expected consequence of risk, from minor to catastrophic. The other axis has the likelihood or occurrence of the risk becoming realized, ranging from rare too certain.
The boxes within the grid then contain classifications ranging from low to extreme, which provide a prioritization to address the risk in some fashion. Low-risk items are those with rare occurrences and insignificant consequences. The other end of the spectrum are extreme risks that are almost certain to occur and have catastrophic results.
How a Risk Matrix Works
The matrix is a communication device. The work to identify and understand risks is the topic of other discussions on FMEA, hazard analysis, or other risk identification activities. Once you have a set of identified risks, a common next step is to prioritize the risks for action to mitigate in some fashion.
When faced with many risks many of the risk identification and prioritization tools are not well suited to provide an overview on one page. Thus the use of a risk matrix.
For each identified risk use the consequence and likelihood levels to map the risk to the matrix. Add the name or an identifier for each risk into the appropriate box on the matrix. For example, a risk with a possible likelihood and moderate consequence maps to about the center of the matrix below which happens to be a yellow-colored box.
The colors of the box, some use labels as well, indicates the level of risk. The levels are determined by local or corporate policy. For each box in the matrix, pre-decide which are considered extreme risks and give them a dark red color, for example. In the example matrix here, dark red is an extreme risk, red is high, orange is serious, yellow is moderate, and green signifies low risk.
 As the situation or knowledge concerning risk changes, it may move within the matrix to other boxes. Once an identified risk has found a spot on the matrix doesn’t mean the situation doesn’t change. Shift items as needed.
Pro’s and Con’s to Consider
Creating a matrix is a graphical way to map identified risks to risk categories. For example, if comparing two potential vendors, which each present a different set of risks, do the work to identify and understand those risks. Then create a matrix presentation for each vendor. Graphically it is easier to see which vendor has a set of higher risks than the other.
The matrix can provide a means to present the current understanding of identified risks for a project, program, or organization. It is a versatile tool. It should lead to discussions on the highest risks and any appropriate mitigation strategies.
On the other hand, a risk matrix is not all that useful when attempting to display large numbers of risks. With a typical resolution of 3 to 5 levels per likelihood and consequence, it doesn’t provide separation between risks within each box. Adding more levels may quickly exceed the ability of the risk identification process to accurately label risks, or simply increases the burden to create the matrix.
The matrix assumes each identified risk is independent, yet that may not be the case. Focusing on one mitigation may affect multiple risks, yet if all are of a moderate category may not receive the resources to be solved.
Also, the matrix only reflects the risks identified and their associated likelihood and consequence. If the prior process is not done well, the matrix may provide a nice visual result of a faulty process. Thus, leading to an uninformative graphic and the potential to lead to poor decisions concerning risk mitigation priorities.
Custom Building Your Risk Matrix
The matrix may provide a way to communicate the project’s or organization’s risk classification policy. The color or category of risk for each box is determined locally. The number of categories may range from 3 to 5, typically. You also can adjust the number of boxes that fall into each risk band as you deem appropriate.
Another customization is to create the two axes with labels that are consistent with your risk management program’s set of labels for likelihood and consequence. The matrix could match both the number of levels and the names to provide consistency across the risk management program.
A risk matrix is a flexible and useful tool when used to communicate identified risks. It is a tool to facilitate discussion, prioritization, and resource allocation as the team involved considers risk mitigation or the status of the current risk posture.
Bio:
Fred Schenkelberg is an experienced reliability engineering and management consultant with his firm FMS Reliability. His passion is working with teams to create cost-effective reliability programs that solve problems, create durable and reliable products, increase customer satisfaction, and reduce warranty costs. If you enjoyed this articles consider subscribing to the ongoing series at Accendo Reliability.