 Your assessment needs a clear framework to help you process the information you have and analyze the risks. Sometimes you will have one prepared but at other times, you need to do this yourself. Whatever the situation, you need to know what goes into designing and building a framework if you’re going to be successful.
You will often find that the categories, methodology and metrics you’ll use to actually evaluate your risk are given to you or prepared in advance. You simply take the information you’ve already gathered and pass it through the system.
But what do you do if you don’t have a neatly laid out process? Or how can you spot where there’s a flaw in the methodology being used?
In these cases, I think you need to have a good understanding of what’s going on under the hood. That will allow you to apply an existing process more effectively and will also allow you adapt things to better suit your own organization if necessary.
This is an excerpt from Beyond The Spreadsheet: A Practical Guide to Understanding Your Risks. You can learn more about the book here and CERM-RI subscribers get a special 25% discount if they use this link.
I’m using the term framework here to refer to all the components you need to analyze the risks you’ve identified to give each a value and subsequently put these into order.
The elements of a framework● Categories – a set of imaginary buckets or folders into which you can group similar threats. ● Methodology – the formulaic definition of risk you will use for your actual calculations. This defines risk as a set of components and describes how they interact. ● Metrics – the values you will use to describe and ‘measure’ each component and the risk itself. |
It’s important that you understand how these different parts of the framework interact because you are either going to be the person who has to design them, the person who has to explain them to others or the person that has to unpick a standard or SOP to turn it into something workable. This last point isn’t always as straightforward as it seems.
There was one US standard that probably took me 20 hours over a period of weeks to decipher and turn into a clear framework and that certainly wasn’t the only time an SOP or guide has required significant effort to unpick. But if you can’t define these elements clearly – whether you’re the designer or the user – then your evaluation will be shaky and might not work at all.
Luckily, there’s a simple way to tackle each of these. Let’s start with categories.
Categorization
To manage your risk management system, you need to have a way to categorize your threats. This is a key part of being able to structure your risk assessments and you need to identify a set of imaginary buckets or folders into which you can group similar threats.
This also helps with information gathering, as data on a specific threat category might be grouped together, and it can be extremely useful when it’s time to address the risks, since one action could help mitigate a whole category of threats. Finally, these categories will also help you identify trends and patterns and start to develop an overall picture of your risk environment.
It’s worth spending some time getting this right as it will have an influence on your risk management system and once you start using a set of categories, changing them can be messy.
But deciding upon these categories can be deceptively difficult. There are three reasons for this.
Firstly, categorization can be interpreted as reflecting ownership. So if you have a category called ‘financial’ then it’s not going to be a surprise if the CFO assumes that this is her responsibility. Sometimes, as with the CFO example, ownership could be straightforward but sometimes it leads to turf wars over who owns a set of risks. Trying to get people to agree can therefore become complicated.
The second reason is more problematic. Depending upon how you describe the threat category you can end up talking about the impact and not the threat itself. For example, if you have ‘flooding’ as a category, you’re talking about the effect (the impact), not the cause (the threat from hurricanes). This will influence all of your thinking throughout the process and it can make discussions very complicated and sometimes result in you talking around in circles.
This happened to me once when a co-worker and I sat in a room for two days with a whiteboard and lots of sticky notes, trying to design a series of threat categories. By the end of day one, we were confusing ourselves, going around in circles and had stopped talking to each other so we had to quit for the day.
When we came back in on day two, we realized that we had stopped talking about threats at one point and had started to add effects and impacts. We had flummoxed ourselves by mixing threat categories in with impact descriptions. Once we identified this problem, we were quickly able to fix things and built a system that’s still valid today, more than 15 years later.
Thirdly, it can be hard to get the right balance between categories that are too broad and categories that are too specific. There’s a ‘Goldilocks’ point at which the categories are specific enough to keep similar items together but not so specific that you end up with a list of individual threats.
Imagine you needed a way to categorize sports teams. ‘US Sports teams’ would be a very broad category, but ‘The New York Giants’ or ’The Mets’ are specific teams. Instead, ’NFL Teams’ and ‘MLB Teams’ might be useful categories.
A simple way to help keep things under control is to just count the number of categories. If you only have two (e.g. Internal or external threats) it’s probably too few. On the other hand, if you have 25 categories, that’s probably too many.
I think that somewhere between six and ten is usually enough. When I designed DCDR, I felt that the six below covered most eventualities
- Market / Financial
- Statutory (regulatory) / political
- Safety / security / health
- Environment
- License to operate / reputation
- Infrastructure
(There’s also an ‘other’ option for users to add their own.)
This isn’t a hard and fast set of categories but I don’t think I have had to use the other category so far: most of what I’ve been considering can be slotted into one of these categories.
So spend some time thinking about what the right categories are for your organization. Getting this right will help shape your discussions and make it easier to analyze the results without becoming too specific: that’s what the individual threat description is for.
Methodologies
Next is the methodology. The methodology is essentially the formula you’re going to use to calculate the risk and this is going to be based on your definition for risk. Sometimes the definition does the work for you but at other times, you need to do a little work yourself.
For example, in many cases the definition of risk is likelihood plus severity which is great for methodology because I just add the two components together. Therefore I can write out my methodology like this
risk = likelihood + severity
All I need to do is add the metrics and off I go.
However, although this definition is easy to use as a methodology, it’s not as useful for more general discussions about risk as we haven’t actually defined what risk is.
So you will often come across definitions that address risk more as a concept which makes it easier for people to understand what a risk is, rather than what it’s made of. Essentially it’s the difference between describing a car as a machine that has an engine, wheels and seats (what it’s made of) instead of saying it’s something for moving people over long distances on land (what it is).
Unfortunately, a description of risk as a concept might need some extra work to turn it into a methodology. For example, if we use the ISO definition, we get risk is “the effect of uncertainty on objectives.” (ISO 73) That obviously requires a bit more work than the previous example. However it’s not as complicated as it might seem at first. If we take a closer look, two main components jump out :
the effect (1) of uncertainty (2) on objectives
If we want to turn this into a methodology we need to know how much of an effect we are talking about and how much uncertainty is involved. So we can combine the magnitude of the effect plus the degree of uncertainty to determine our risk which gives us
risk = magnitude + uncertainty
If we refer back to the first example, this isn’t so different from
risk = likelihood + severity
We just have the terms in different order.
However, it’s sometimes more complicated. Remember that standard I struggled with? Well, here’s the eventual methodology I pulled from a several page-long description.
risk = L2 * C where L2 = L1 * V and L1 = A * T
Or…
risk = (((A*T)*V)*C)
(Actually, this formula is even more complicated than it seems but that’s a discussion for another time.)
Again, if you are using a standard or pre-existing procedure, then this work should have been done for you. However, you should still be able to unpick things yourself because you need to be able to link the standard to the process and there are times when the work hasn’t been done and you will have to decipher the standard yourself.
If I didn’t understand how to unpick a text to find the methodology, then I couldn’t have pulled that horrific formula from the standard. Also, if I’d given someone the formula and asked them to check it, they’d need to be able to work backwards to the standard in order to check that my formula fits with the description.
So even though this might seem unnecessarily detailed and it might feel as though we just ditched the last S in KISS, this is a situation where the explanation is more complicated than the process. In a moment, I’m going to show you how everything gets pulled together but before that, we need to talk about the final part of the framework: grading and metrics.
Metrics
Finally, whichever risk assessment methodology we use, we need a set of values to apply to each factor to help us determine a rating for individual factors and the overall risk. This can be achieved using numerical values, qualitative statements or color coding. Applying scales like these allows us to grade and order our risks which helps with prioritization and comparative analysis.
- Quantitative values allow you to easily order and compare risks
- Qualitative statements make it easier to discuss or describe factors
- Color coding provides a visual key to differentiate between different ratings
For ease, I will refer to these collectively as metrics. An example set of basic metrics is shown below.
| 1 | Low | Green |
| 2 | Medium | Amber |
| 3 | High | Red |
Although it might seem more complicated initially, having all three options available to start with makes your assessment easier in the long run. This allows you to use the appropriate value or description to suit the stages of the process while ensuring that these are consistent throughout your assessment.
For example, you can use Low / Medium / High as descriptive terms during discussions which then become numeric values in your assessment template. These are then highlighted with the appropriate color to provide a visual key. The important point here is that ‘Low’ now has a distinct and fixed meaning and is just as explicit as a value of 1.
The same basic approach can be used for sets of metrics with more variables or options. Metrics with values from 1 – 5 are quite common. For simplicity, we are going to stick with three values for the rest of this section.
Once you have your metrics, you just insert these into whatever tool or template you are using.
Tools (1) – Spreadsheets
Spreadsheets are useful tools for basic risk assessments and the most common. Excel and similar spreadsheet programs are widely accessible making these easy to complete and share. If a spreadsheet is set up correctly, it will provide a quick and easy way to manage, assess and grade risks for a simple situation.
If we use one of the basic risk methodologies we discussed above
risk = threat x vulnerability x impact
we end up with something like this.
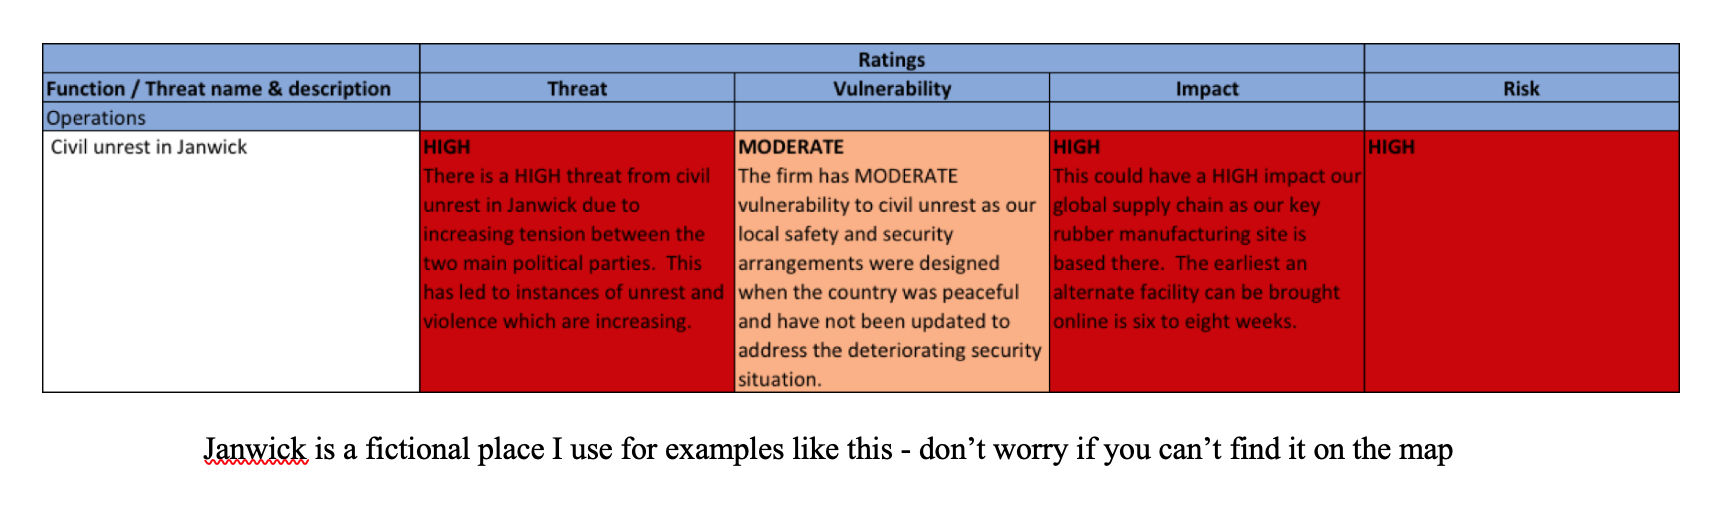
Janwick is a fictional place I use for examples like this – don’t worry if you can’t find it on the map
Again, more complicated formulas can be tackled in a spreadsheet. The more complicated the formula, the more care that needs to be taken to ensure that all of the links and formatting are set up correctly. One additional tip is to lock down as much of the spreadsheet as possible. This should allow you to set criteria so only the permissible values (e.g. 1 – 3) can be added and lock cells so only the description and value can be added. Otherwise you will find that people accidentally change the formulas and formatting which is a disaster.
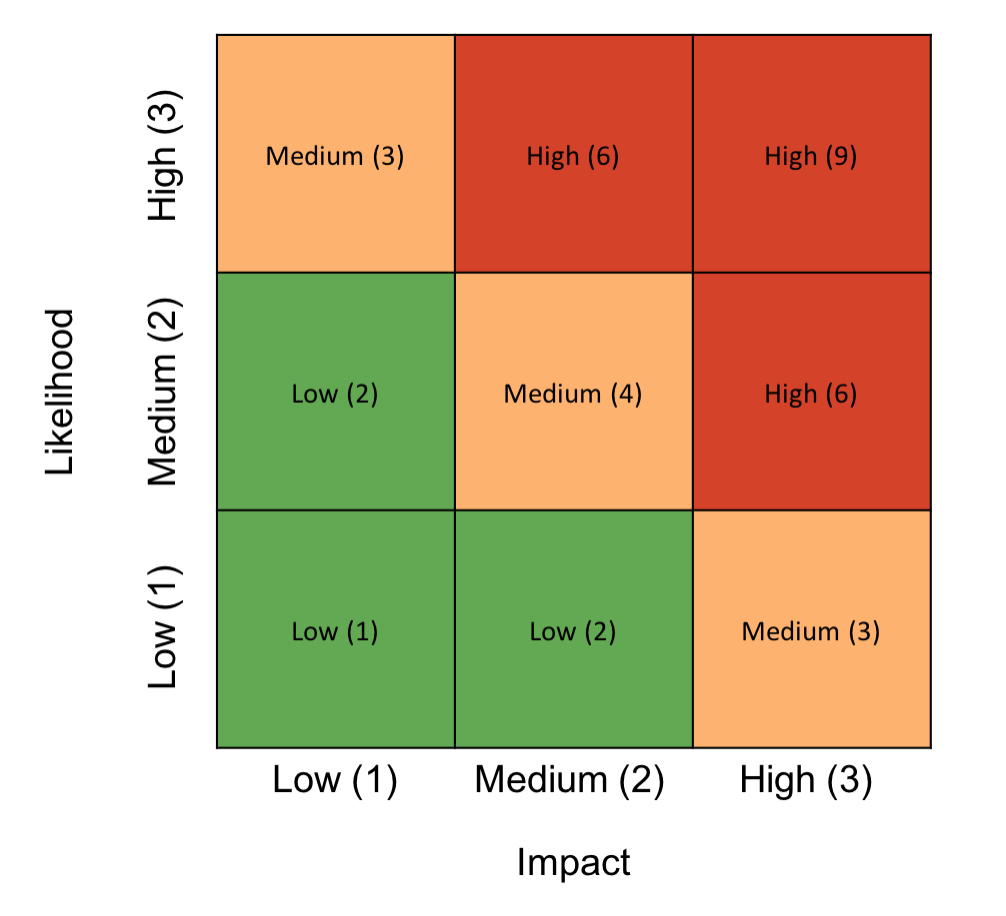
Tools (2) The Boston Square
The Boston Square is another popular tool for risk assessments and can be used as a stand-alone tool or a way to represent risk results. The Boston Square presents information with two values on a color-coded grid. This works well if you are using the basic likelihood x impact formula: you simply allocate an axis to each factor and plot risks on the grid accordingly.
This example shows the overall risk value for each quadrant:
 This example plots the infrastructure risk as described in the likelihood x impact spreadsheet above:
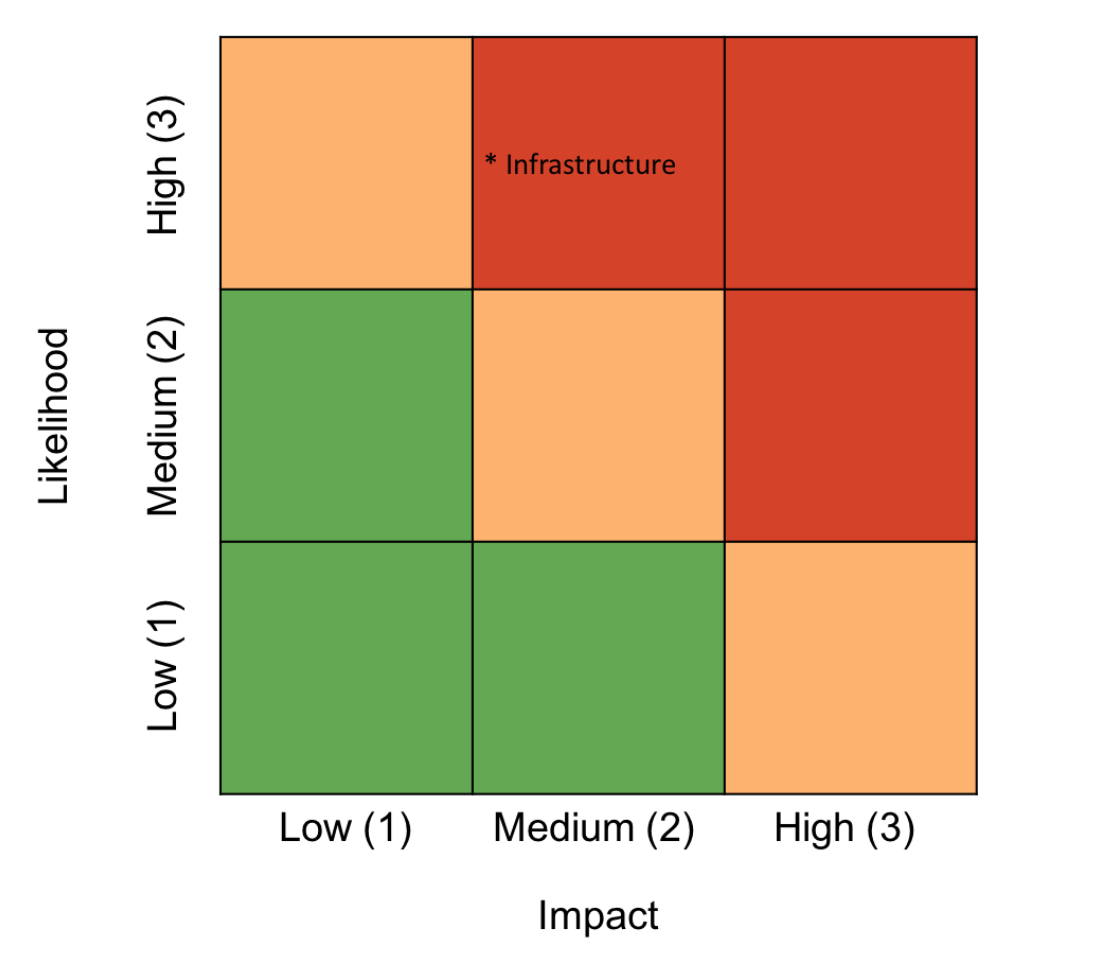 The Boston Square is often used as a simple way to brainstorm risks in a workshop. Note that this approach allows a lot of bias and subjectivity into the assessment, rather than evaluating each risk on its own factors, so there is a tendency to immediately start to compare risks to one another.
Although I would recommend that you use a different tool for assessing your risks, the Boston Square can still be used as a way to represent the findings of your assessment. You can begin by assessing the risks in a spreadsheet before transferring the final results to an appropriately marked Boston Square. This provides a simple way to represent your findings while maintaining the objectivity of the assessment process.
More Detail = More Refinement
The r = tvi formula that I prefer (more on that in the next part) uses a similar metrics structure but has five different values and ratings to allow some additional refinement in the results. The metrics are shown below and I have also included a short description of what each term could mean when used to describe a different factor. These definitions are not fixed and this is something that can be adapted for your organization or the particular assessment.
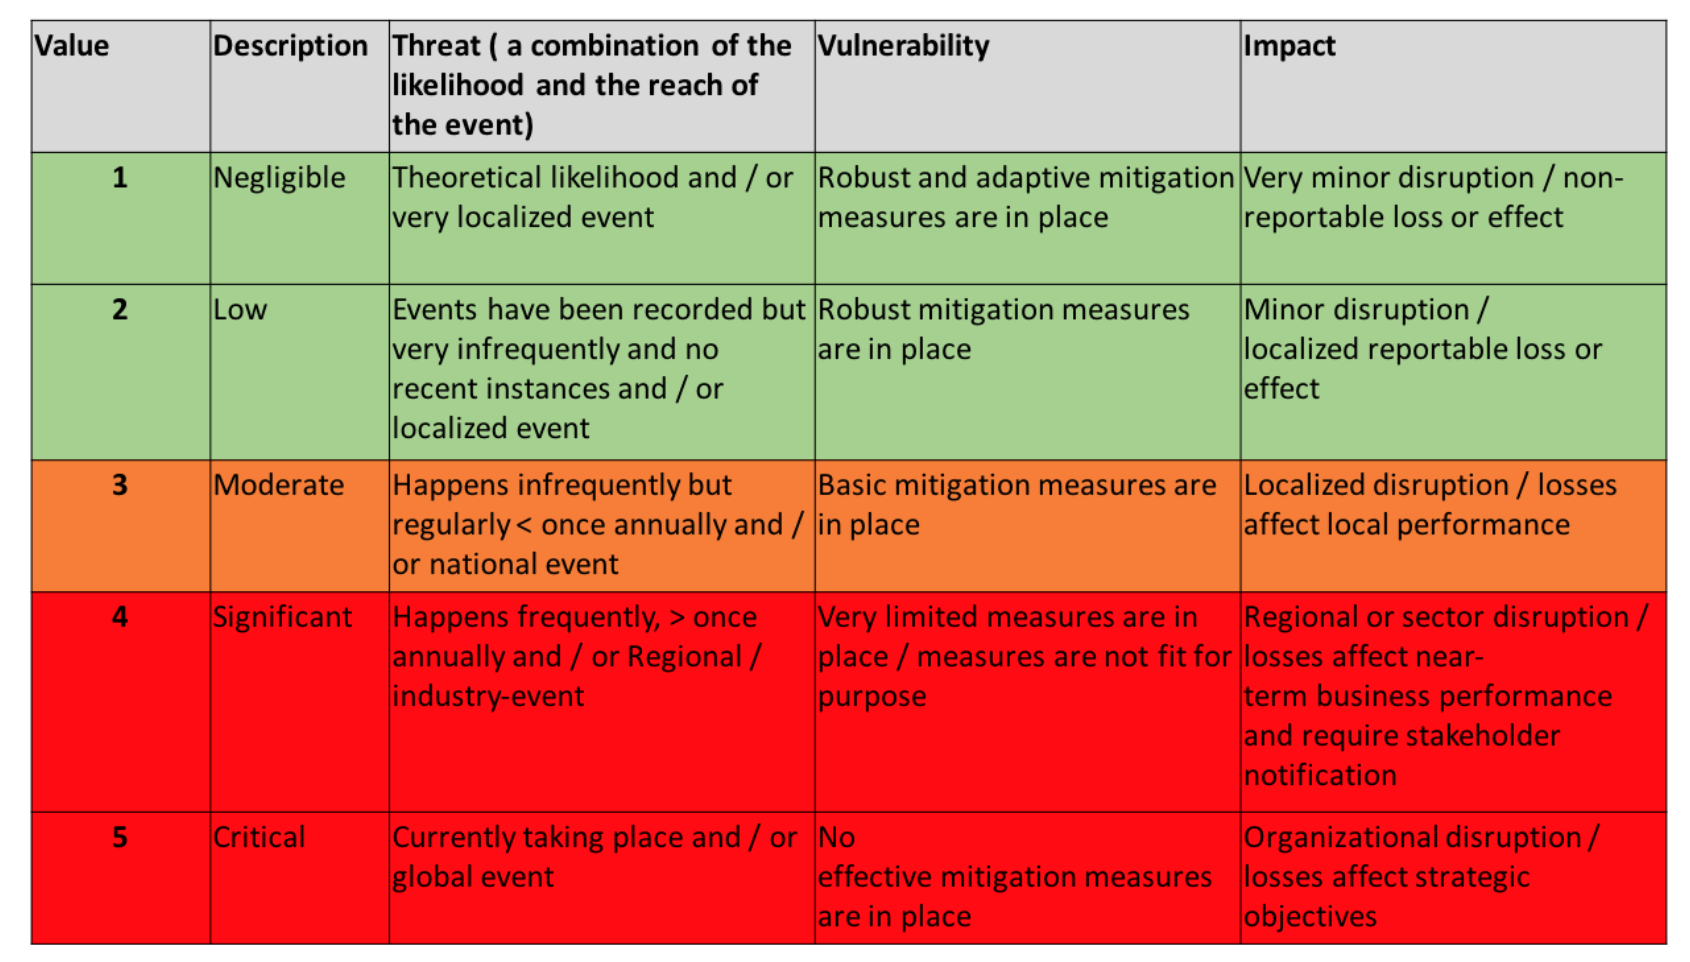
Although this is a little busier than the previous example, the underlying concept is the same. A value, color or term can be applied to each factor.
We can’t use a Boston Square here as that limits us to two factors but we can use other graphs and charting tools to represent our results, as required.
An example of one comparison graph is shown below. It illustrates how overall risk can be compared to the likely impact of an event. This helps highlight higher impact events irrespective of their overall risk as these can be particularly damaging to an organization.
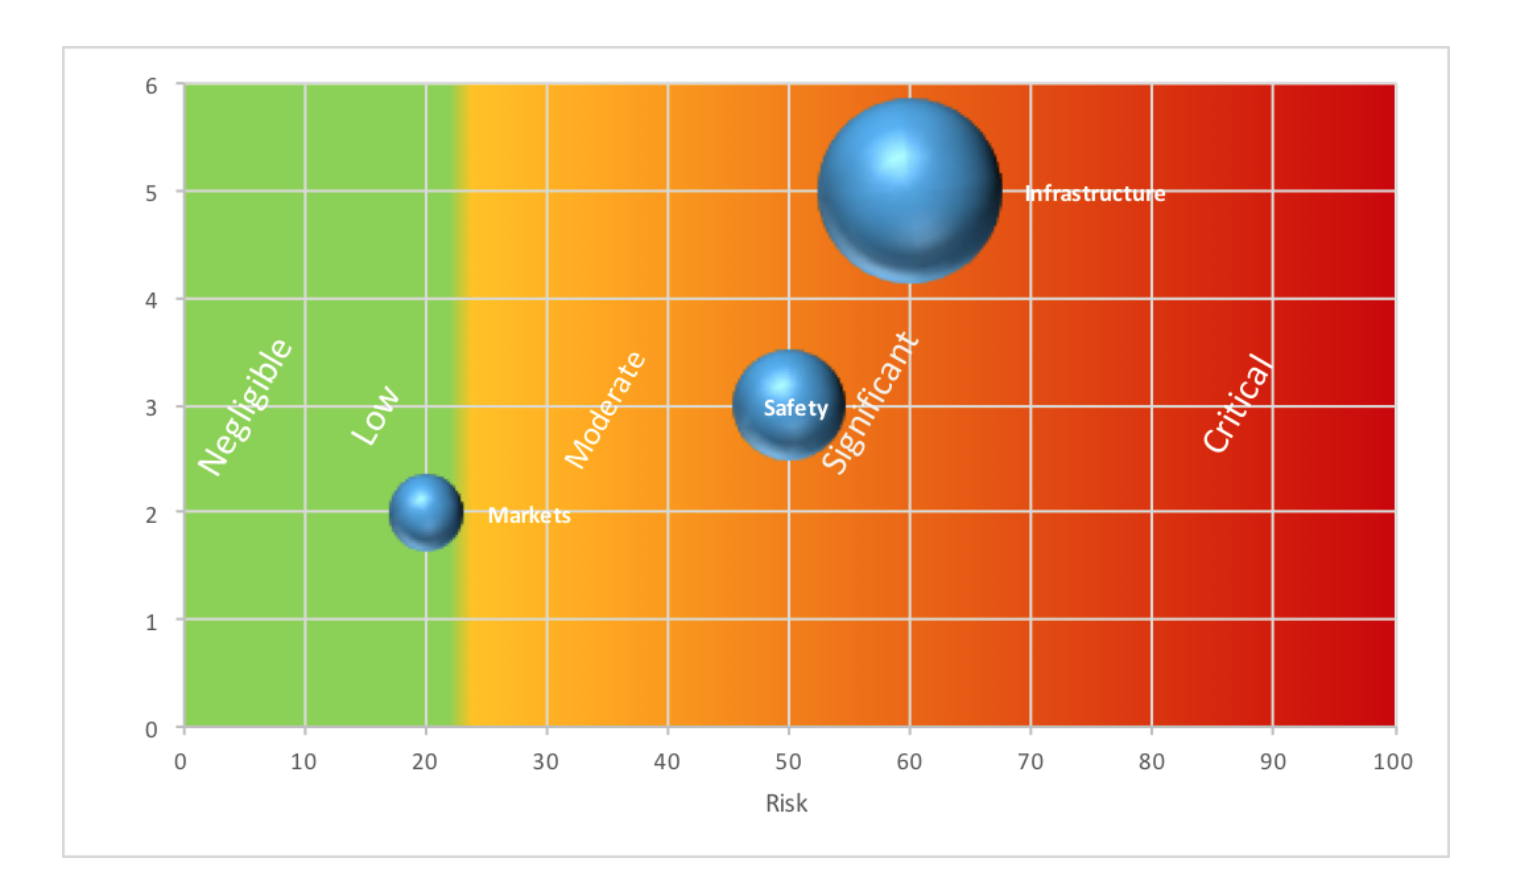
For example, in this case, although safety and infrastructure threats pose similar risks and would both fall into the ‘significant’ category, infrastructure risks carry potentially higher impacts which might prioritize this as an area for action.
None of these examples are provided to give you the ‘perfect’ way to present your data. Remember, the approach you take will depend on your client. However, it’s worth being aware of some of the different ways you can present your information and results as this will give you additional flexibility when you’re planning your own assessment.
Summary
There are many systems and methodologies for risk assessment. Most involve a set of metrics with some combination of descriptive terms, quantitative values and a color-code. Personally, I now use the r=tvi model and the DCDR.io assessment tool I built for assessments. I save the Boston Square for more subjective brainstorming to compare options.
However, whichever approach you use, the options outlined above offer some basic frameworks that can then be built on for more complicated systems that you can adapt for your own assessments in the future. The key thing to ensure is that you have a clear and robust system of grading and metrics in place before you start.
This is an excerpt from Beyond The Spreadsheet: A Practical Guide to Understanding Your Risks. You can learn more about the book here and CERM-RI subscribers get a special 25% discount if they use this link.
Andrew Sheves Bio
Andrew Sheves is a risk, crisis, and security manager with over 25 years of experience managing risk in the commercial sector and in government. He has provided risk, security, and crisis management support worldwide to clients ranging from Fortune Five oil and gas firms, pharmaceutical majors and banks to NGOs, schools and high net worth individuals. This has allowed him to work at every stage of the risk management cycle from the field to the boardroom. During this time, Andrew has been involved in the response to a range of major incidents including offshore blowout, terrorism, civil unrest, pipeline spill, cyber attack, coup d’etat, and kidnapping.
Andrew has distilled these experiences down to first principles to develop the KISS Risk Management framework, a straightforward, effective and robust approach to risk management. This aims to make high-quality risk management tools, resources, and training accessible to as many people as possible, particularly those starting out in the field of risk. He has also developed the dcdr.io risk management software platform and several online assessment tools to complement the KISS framework.
Andrew has an MSc in Risk, Crisis and Disaster Management from Leicester Univerity and has written articles for several publications including the RUSI Journal, ASIS Security Manager Managzine and the International Association of Emergency Managers Bulletin.
Email – andrew@andrewsheves.com
Website – https://andrewsheves.com
Software – https://dcdr.io
Linkedin – https://www.linkedin.com/in/sheves/