 In the previous article (Enabling Agile Enterprise Risk Management Part II: Disciplines) I identified the disciplines necessary to enable you to transform your enterprise at speed. At the conclusion of that article, I promised to present a design for a repository and system to support AERM. This article will fulfill that promise.
Classifying Risks
Every organization faces myriad risks and they must be prioritized and quantified to inform how it will deal with them. The general approach employed by many risk practitioners is fairly simple: risk severity = likelihood of occurrence x impact. A low-likelihood, low-impact event is a low severity risk and one that ranks high on both scales is a high-severity risk. The severity for a risk with a low likelihood and high impact (or vice-versa) is more open to interpretation. Often the scales used for these dimensions are 1-3 or 1-5, low/medium/ high or green/yellow/ red. While this might be a reasonable start to identifying and managing risks, it’s not nearly comprehensive enough.
It’s important to identify to where in your EA model risks attach to add context beyond just their severity. (Remember that Capabilities are what your organization is able to do to produce value and Enablers are people, processes, technology and assets that support them.) A severe risk that attaches to a relatively meaningless or easily replaced Enabler is less worthy of immediate action than a less severe risk attached to a mission-critical Capability or its Enabler. One thing missing from many risk classification models is dependency.
Dependency reflects how reliant an entity is on anything it requires to perform its function. In a manufacturing business with a single plant, the Capability to build products is critically dependent on its plant. If the plant were to become incapacitated, the impact to the business could be severe, indeed. This might be mitigated by a mutual backup agreement with another company that has a plant with compatible facilities but this wouldn’t happen unless the dependency were recognized as contributing to a severe risk.
Measurements for Dependency must account for shared Dependency. For instance, a manufacturing company has an assembly plant and two large warehouses, either of which could be shared and partially converted to alternate uses. Because of the redundancy, neither of the warehouses is viewed as severely risky on its own and the dependence of BU1’s manufacturing Capability on both of them is moderate. If a new product line (BU2) were introduced and Warehouse 2 partially converted to provide manufacturing Capability for it, then Warehouse 2 would become more risky by virtue of the new, higher dependency suddenly attached to it, all else being equal. However, it’s not as simple as that. The riskiness of the converted Warehouse 2/assembly plant really hasn’t changed from the perspective of BU1’s manufacturing Capability—it’s still only being used as a warehouse and there is a redundant one that can serve if anything happens to it. It is, however, very high risk to BU2’s manufacturing Capability for which it serves as the only assembly plant.
Merely increasing the potential impact of the risk of an outage at Warehouse 2 to account for the dependency of BU2’s product line could improperly allocate the incremental risk to BU1. However, the riskiness of Warehouse 2 should still reflect that something new is heavily dependent on it. A more nuanced approach is required.
Modeling Risks, Dependencies and Shared Dependencies
The two diagrams, below, depict a subset of a model embodied as a graph database designed around the organization’s EA model. Diagram 1 shows the relationships among a Capability (BU1’s manufacturing,) three of its Enablers (the Factory and the two Warehouses) and Risks attached to the Enablers (only those for Warehouse 2 are shown.) Diagram 2 shows how this would change if BU2’s manufacturing Capability were enabled in the second warehouse.
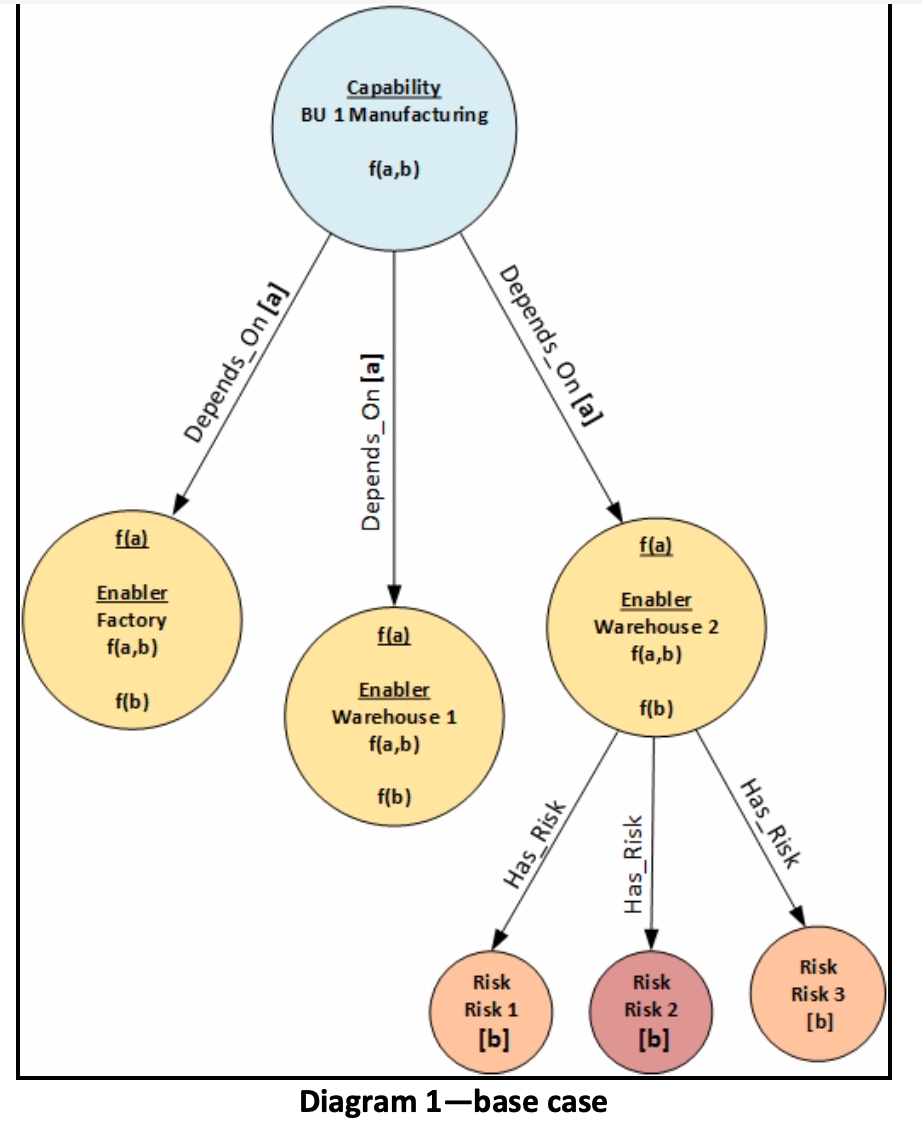
This diagram contains a number of elements:
- It consists of two types of objects—nodes (the circles that represent EA entities) and relationships (the arrows between nodes)
- Properties (which are equivalent to variables or columns in a relational DB) can be attached to either nodes or relationships.
- The relationships labeled Depends_on have property a, which indicates the degree to which the Capability is dependent on the Enabler to which it relates
- Risks contain property b, which indicates the severity of the risk to the entity to which it’s attached, in this case, the Enabler Warehouse 2.
- The nodes contain properties that aggregate values from nodes to which they have relationships. For instance, Warehouse 2 contains three of these:
- f(a), a measure of aggregate dependency from all Capabilities that depend on it,
- f(b), an aggregate of the severity of Risks that have been identified for it and
- f(a,b), a measure of aggregate risk associated with it, given what depends on it, how strong the dependence is and what the aggregate risk severity is, given severities of the risks that are attached to it.
Diagram 2, below, shows the impact of enabling Business Unit 2’s manufacturing Capability in Warehouse 2:
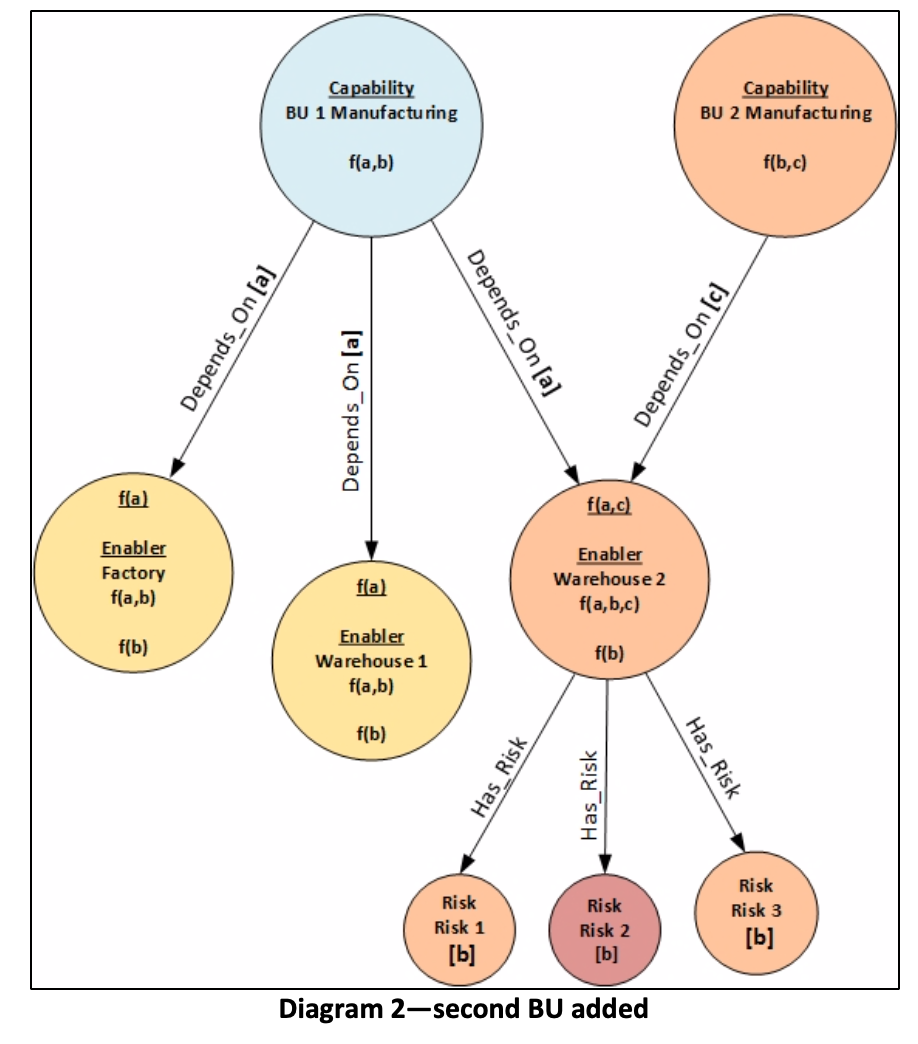
What this documents is:
- f(a,c) the aggregate measure of dependency of the Warehouse, is now a function of the dependencies of both Business Units. That of BU2 (f(c)) is greater than BU1 (f(a)) because of the stronger dependence of BU2 on it than BU1 has (a < c). It will be a single point of failure for BU2.
- This may imply a need to take measures to de-risk the Warehouse if BU2 is added that would not be justified for BU1, alone.
- The aggregate risk severity (f(a,b,c)) for the Warehouse is a function of the dependency measures of both BUs (a and c) and the severity calculated, as before, from all of the Risks attached to it (b). In reality, new risks would probably attach to Warehouse 2 as new manufacturing capabilities that it enables are added.
The mathematical functions that you use to represent risk severity and aggregation are up to you. For instance, you might want to use residual severity (the severity that remains after you mitigate a risk) rather than the pre-mitigation severity that is ‘organic’ to it. You might also choose to aggregate by using the maximum dependency value or risk severity rather than an average or some other function among all related entities.
Takeaways
Interactions and dependencies between entities in your organization determine how risks are experienced. When your EA is in flux, new entities, new relationships, changes in dependence or changes in risks can propagate in unexpected ways and must be accounted for and treated to avoid unplanned-for exposures. Modeling risks on a framework structured around your EA model provides the most comprehensive view of your organization’s anatomy and is the best basis for informing and directing your ERM efforts.
Implementing a system-supported model will enable you to explore alternatives and select from among options for responses much more rapidly than might otherwise be the case. To operate at the speed required for digital business, this is a crucial ability.
It is up to you to determine how you will model, measure and aggregate risks for your company. What is important is that you do it.
BIO:
Howard M. Wiener is Principal of Evolution Path Associates, Inc., a New York consultancy specializing in technology management and business strategy enablement. Mr. Wiener holds an MS in Business Management from Carnegie-Mellon University and is a PMI-certified Project Management Professional.
He can be reached at:
howardmwiener@gmail.com
(914) 723-1406 Office
(914) 419-5956 Mobile
(347) 651-1406 Universal Number