 Two schedule tools are widely used for the Integrated Master Schedule (IMS) around the world to manage projects. The first one is Microsoft Project (MS Project). The second one is Primavera P6. They are both very good. Primavera P6 is an Oracle product originally designed for the construction industry. MS Project is simpler and easier to learn based on my experience. It also costs less than Primavera P6. DOD uses MS Project and typically requires it for use on government contracts. Other industries use one or the other depending on the size and complexity of the project.
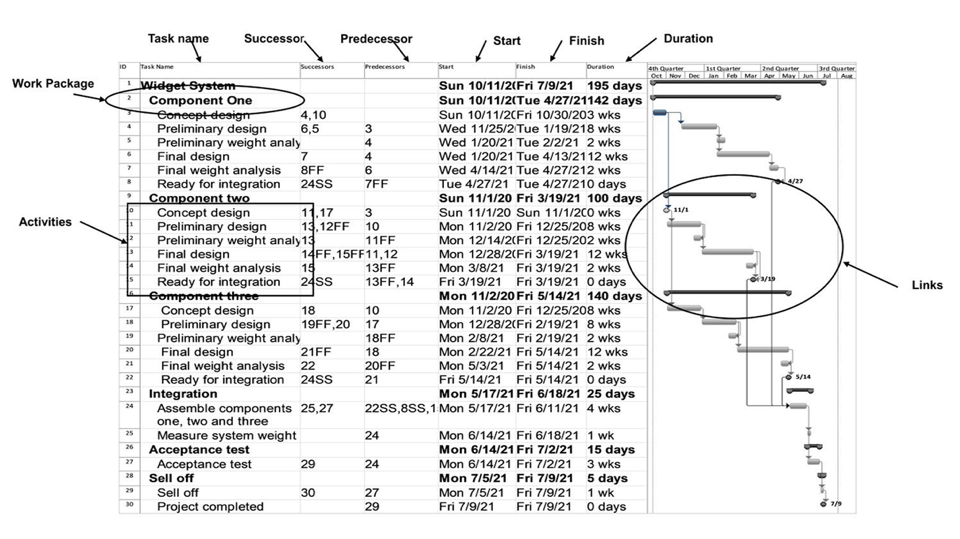
As shown in Figure 1, the IMS is structured around work packages (WPs) and activities. The WP are the tasks. The activities are subtasks of each WP with a duration and are linked together to form the IMS logic. WP budgets are allocated to each activity. Together they form the integration of task, schedule, and budget.
Data can be exported from the IMS to Excel and curves created to reflect project performance. The curves help you manage the project and report to management. This paper uses MS Project to explain how to do it.
CREATING PERFORMANCE CURVES FROM IMS
The Widget System project is an example to explain how performance curves are created from the IMS. Only one curve is presented as an example due to paper length limits but the process and steps shown below apply to generating other performance curves.
WIDGET SYSTEM EXAMPLE
The Widget System MS Project schedule is shown in Figure 1. There are several columns (aka fields) shown These columns are:
- Task name.
- Successor (following task).
- Predecessor (previous task)
- Finish (date the task is scheduled to finish).
- Start (date the task is scheduled to start).
- Duration (time in weeks, months, or days for the length of the task).
Figure 1 Widget System IMS
EXPORTING IMS DATA INTO EXCEL SPREADSHEET
Excel is a commercial spreadsheet application produced and distributed by Microsoft for Microsoft Windows and Mac OS. It features the ability to perform basic calculations, use graphing tools, create pivot tables and create macros. Excel has the same basic features as all spreadsheet applications, which use a collection of cells arranged into rows and columns to organize and manipulate data. They can also display data as charts, histograms and line curves.
To export the data to an Excel spreadsheet, save the MS Project file to Excel Worksheet in a new folder. As soon as you save it, an export Wizard tool pull down menu appears. The Wizard menu is where you specify the fields (name of task, start date, finish date, etc.) you want. Once this is done, click finish and the data automatically is exported to the new file. Open the new Excel file and you should see the MS Project data.
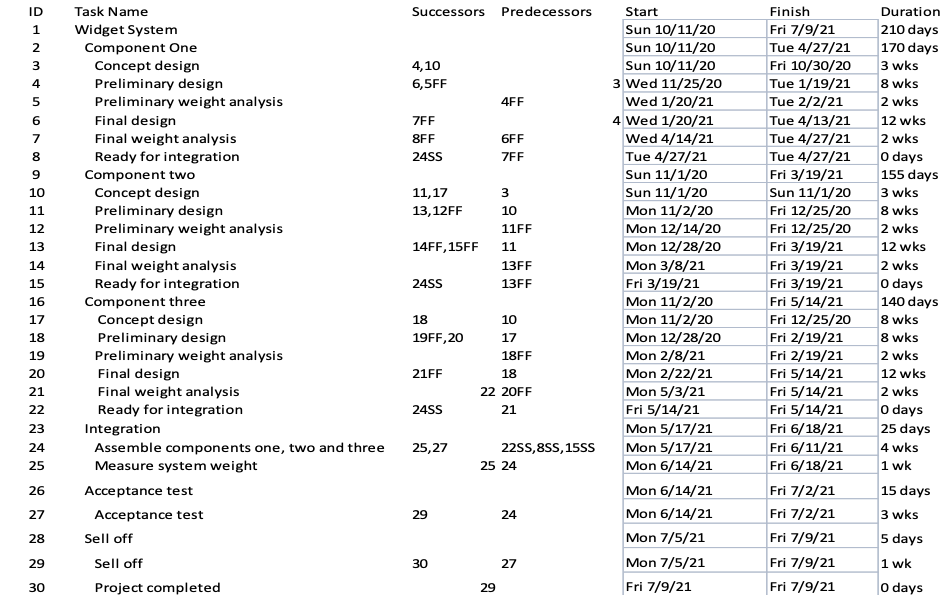
Table 1 shows the exported Widget Project IMS data in an Excel file. In Table 1, the ID, task name, task successors, task predecessors, task start date, task finish date, and task duration have been exported into Excel.
Table 1 Widget System IMS Data Exported to Excel
GENERATE PLANNED AND ACTUAL FINISH TASK DATA TABLE
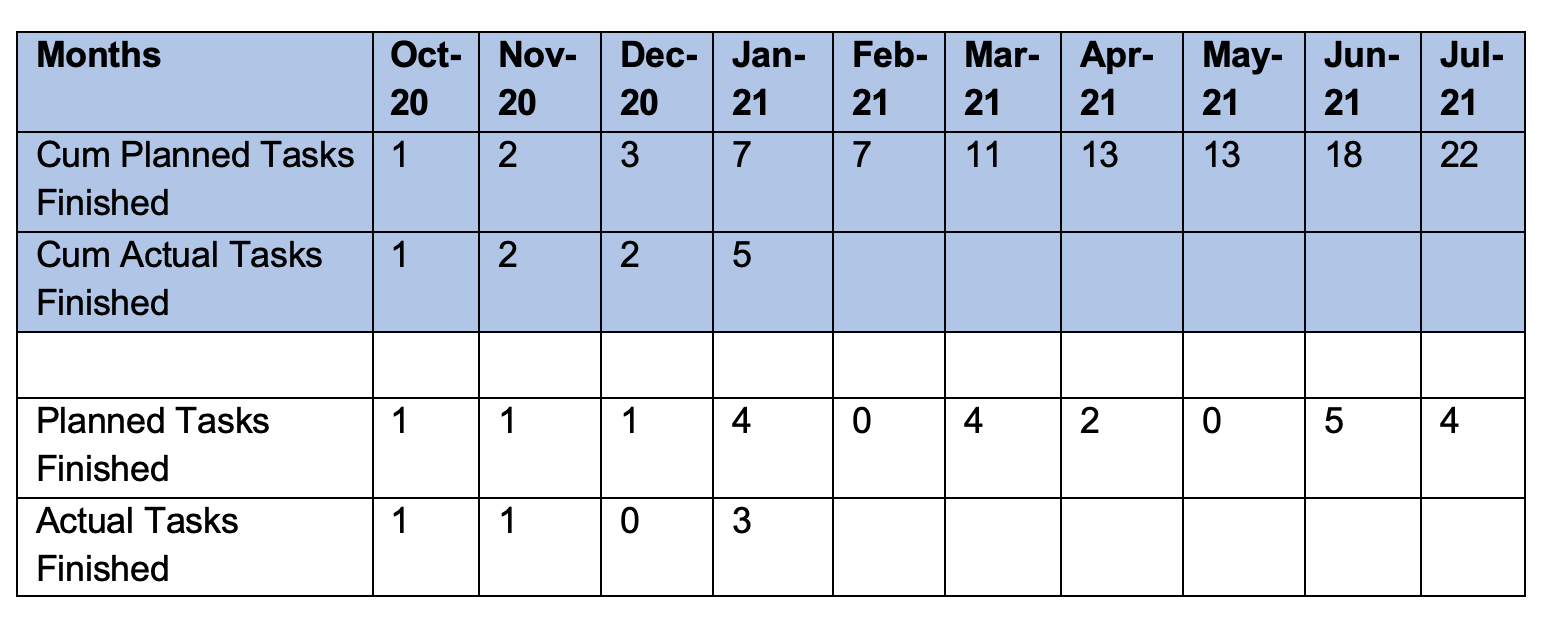
These are the steps to create Table 2:
- Enter the months and year in a row of cells in Excel
- Create a row below the month and year row and title it “Planned Tasks Finished”
- Count the tasks that are finished for each month and enter the number in the Planned Tasks Finished Row
- Create a new row called “Cum (Cumulative) Planned Tasks Finished”. Either calculate by hand or use the Excel built in formulas for each cell to determine the cumulative finish tasks for each month and enter it into the row
- Repeat steps for “Actual Tasks Finished”.
Table 2 Excel Planned and Finish Tasks Table
CREATE PERFORMANCE CURVE
The steps are from Table 2:
- Take the cursor and highlight the month and year row, the cumulative planned tasks finished rows, and the cumulative actual tasks finished row as shown in blue shade in Table 2.
- Go to the Excel “insert tab” and find the line graph pull down menu. Click on the desired line graph (there are several choices). You will see the graph appear in the Excel file.
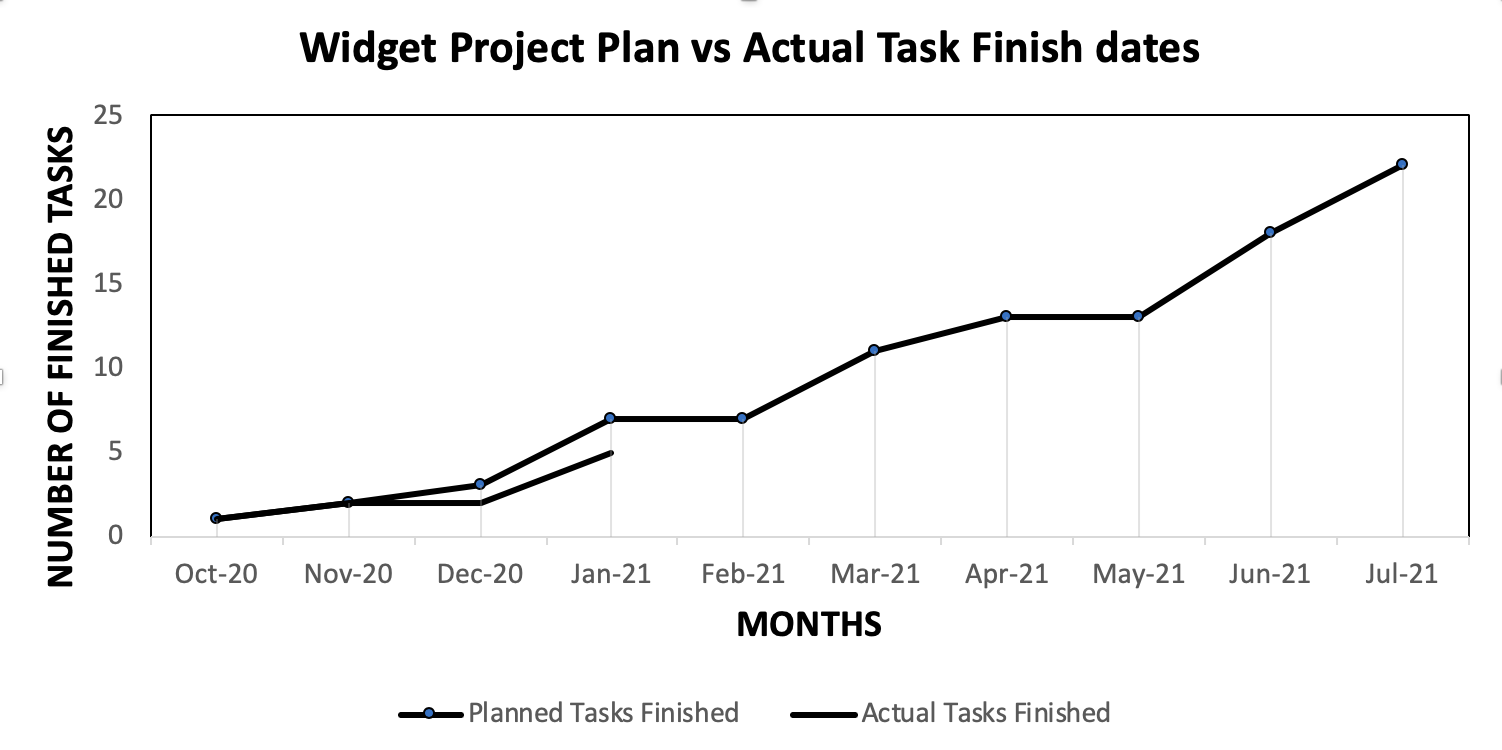
- Add axes titles using the pull-down menu. You now have a graph of the finished tasks data as shown in Figure 2.
Figure 2 shows the cumulative planned finished tasks vs the actual finished tasks curve at the end of January 2021, the date of the reporting period. It can be seen that the actual finished tasks are less than the plan which means the project is behind schedule. This and other project performance curves are very useful in terms of managing the project and reporting status. These and other project performance curves can be created from the IMS.
Figure 2 IMS Excel Data Plotted Curve
SUMMARY
The Integrated Master Schedule (IMS) is the project schedule that integrates cost, schedule and technical tasks. Once approved by the customer and management it is baselined after contract award and becomes the Performance Measurement Baseline (PMB) for the project. It is used to measure performance against the baseline to determine the project status. The PMB cannot change until the customer directs so in writing.
Using the process presented above, any data included in the IMS can be used to create curves. One example for finished tasks is shown above. Figure 3 gives an example of the resource plan for the Widget System project. It shows how the resources need to be staffed for the IMS to be valid.
Bio:
 Currently John is an author, writer and consultant. He authored a book entitled Project Risk Management. It went on sale on Amazon in August 2019. He authored a second book titled How to Get a Project Management Job: Future of Work. It is on sale on Amazon. The first book is a text book that includes all of the technical information you will need to become a Project Manager. The second book shows you how to get a Project Manager job. Between the two, you have the secret sauce to succeed. There are links to both books on his website.
He has presented numerous Webinars on project risk management to PMI. He writes columns on project risk management for CERM (certified enterprise risk management). John also writes blogs for APM (association for project management) in the UK. He has conducted a podcast on project risk management. John has published numerous papers on project risk management and project management on LinkedIn.
John earned a BS in Mechanical Engineering and MS in Engineering Management from Northeastern University. He has extensive experience with commercial and DOD companies. He is a member of PMI (Project Management Institute). John has managed numerous large high technical development programs worth in excessive of $100M. He has extensive subcontract management experience domestically and foreign. John has held a number of positions over his career including: Director of Programs; Director of Operations; Program Manager; Project Engineer; Engineering Manager; and Design Engineer. He has experience with: design; manufacturing; test; integration; subcontract management; contracts; project management; risk management; and quality control. John is a certified six sigma specialist, and certified to level 2 EVM (earned value management). Go to his website to find links to his books on Amazon as well as numerous papers he has written. https://projectriskmanagement.info/