 Job safety has come a long way in 50 years since the Occupational Safety and Health Act (OSH Act) was enacted. The American Federation of Labor and Congress of Industrial Organizations (AFL-CIO) says “more than 627,000 workers now can say their lives have been saved since the passage of the OSH Act.”
But the journey is ongoing and there’s much farther to go in eliminating death and injuries on the job.
Workplace incidents continue to take a toll. The 30th edition of the ALF/CIO report, Death on the Job: The Toll of Neglect, published in May 2021 reveals that, in the United States during 2019:
- 275 workers died each day from hazardous working conditions
- 5,333 workers were killed on the job
- An estimated 95,000 workers died from occupational diseases
- The job fatality rate was 3.5 per 100,000 workers, the same as the previous year.
Employers reported nearly 3.5 million work-related injuries and illnesses “Fifty years after the passage of (United States) job safety laws, the toll of workplace injury, illness and death remains too high, and too many workers remain at serious risk,”
The report says. “There is much more work to be done.” Preventable work deaths increased 2 percent from 2018 to 2019, following on the heels of a previous 2 percent increase from 2017 to 2018. The preventable death rate of 3.1 per 100,000 workers in America has not changed since 2016. Work-related, medically consulted injuries totaled 4.64 million in 2019 – the most recent officially recorded total. Injury Facts reports preventable U.S. workplace deaths in 2019 totaled 4,572 and that number does not include 761 workplace homicides and suicides.
A Canadian 2019 report on Workplace Fatality and Injury Rates shows work-related causes in that country were responsible for 1,027 deaths in 2018 – an increase of 76 from 2017. “In the United States during 2019, an estimated 95,000 workers died from occupational diseases.”
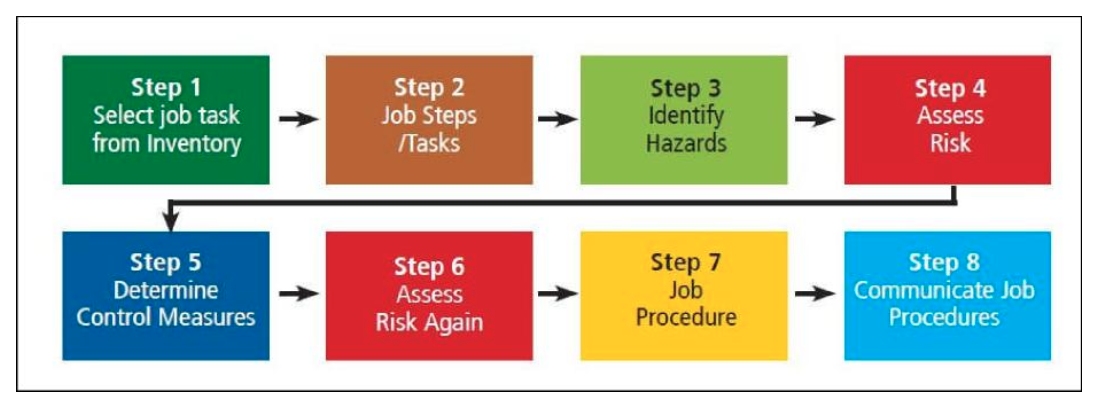
Completely eliminating accidents and deaths on the job is the ideal. Job safety and hazard analysis are essential and foundational tools of the trade to getting there, and the future sees greater use of analytics in the effort to predict and minimize such occurrences. Predicting incidents that might happen is a matter of identifying “causal factors” through data analysis, but these clues are often not apparent and likely to be hidden in variables not captured in incident reports.
It’s a matter of digging deeper into things like equipment operation and process data, vehicle telemetry, weather, geospatial, socio-demographic, human resources (payroll, performance data) and training, industry and other data. It’s here where more advanced analysis comes in to play and will be more deeply discussed in the next report in this series: The More You Know: How Safety Analytics Raise the Bar in Operational Excellence. Through predictive modeling techniques, it’s possible to pinpoint the driving factors behind workplace incidents and develop prevention strategies.
One of the greatest obstacles in analyzing and potentially exposing risks is finding and collecting the data itself. Data usually is scattered across various business systems and is often difficult to access. Not all data is written in common syntax, so it must be interpreted and standardized. And data quality is always an issue. Accurate data, and by extension, data analysis, will become increasingly more important for environmental health and safety (EHS).
In its report, 4 Trends in Occupational Safety and Health to Expect in 2021, McGill University noted that: “In 2021, it will be crucial for all businesses to use their safety data to perform predictive safety modeling. This modeling will aim to anticipate potential safety hazards and establish which conditions increase the occurrence of incidents.”
It goes on to say: “To remain competitive, companies will employ more and more of such machine-learning-dependent safety system and attempt to stop accidents in their tracks before they occur.” Noted was the fact that “predictive analytics are only as reliable as the data they are based on.” This report is of a two-part series. Here we examine risk assessment, job safety analysis and job hazard analysis, and how to build a better model. then this article will consider how the addition of analytics can predictively identify and support efforts to minimize workplace dangers and improve occupational safety.
Risk Assessment
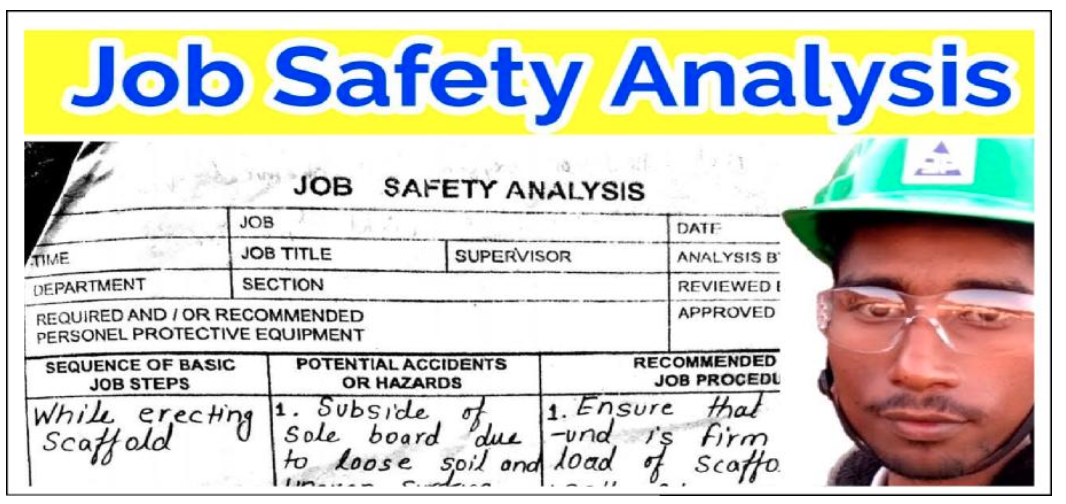
Risk assessment seeks to assess hazards found in a work environment, determine the level of danger that exists in those hazards and assess the likelihood of harmful incidents occurring. It is also the guiding principle behind job safety analysis (JSA) and job hazard analysis (JHA). Risk hazard needs to be evaluated with criteria that assist in building a credible understanding of what is and is not acceptable. Most regulatory bodies require some form of risk assessment of hazards, and all follow a similar template that includes:
- Identifying risks to the worker associated with work activity
- Identifying hazards found in the work environment that pose a threat of loss
- Providing details of identified risks or hazards and context to build understanding
- Utilizing a measurement system to evaluate risk understanding and determining precautions
- Building controls that protect people and the work environment
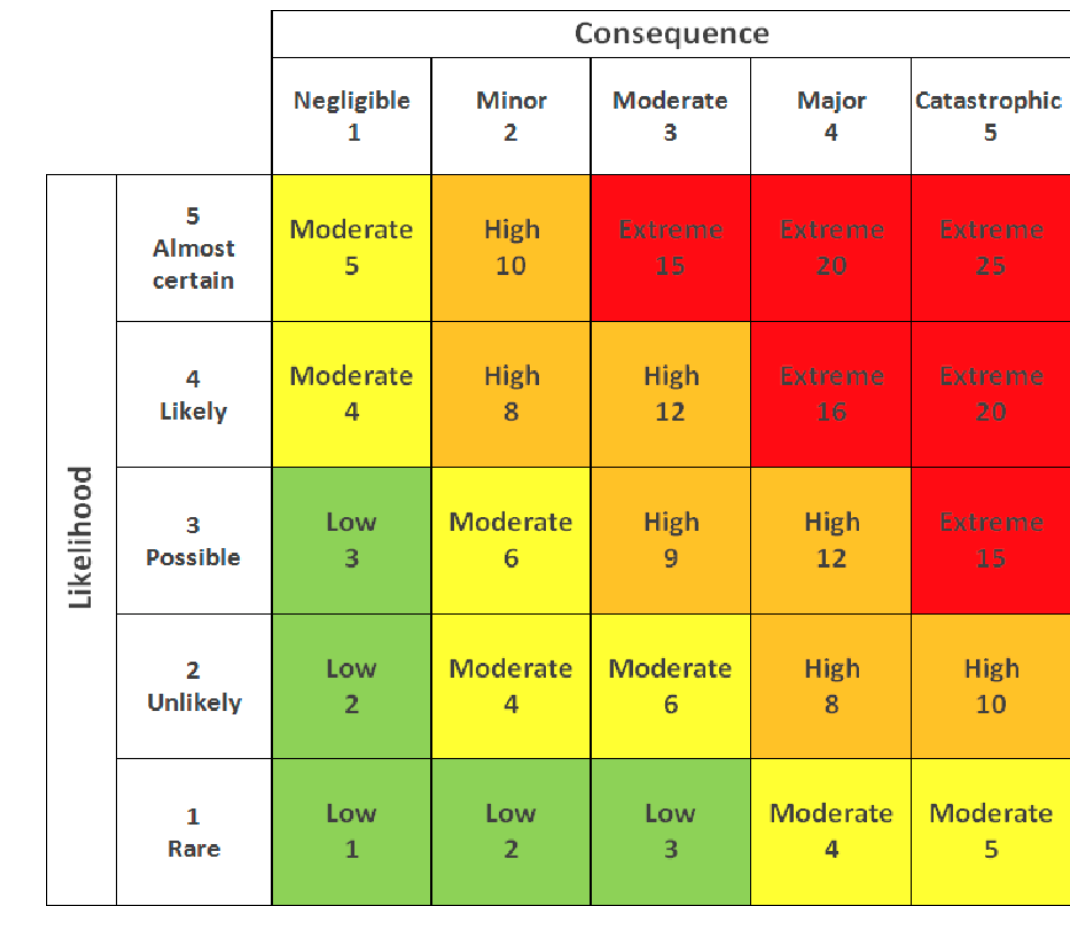
A risk matrix is a commonly used assessment tool for evaluating and estimating risk level. It helps to judge whether the hazard and possible risk are acceptable, scores it and then plots findings on a matrix chart to ultimately determine the level of control required. If the activity rating rises above acceptable levels, then controls are warranted to lower scores.
For every hazard identified during an inspection and for each associated activity, it’s important to ask the question “what if?” What could be the worst-case outcome regarding a hazard or concerning activity? Is it a fatality, significant injury, permanent disability or health effect? Is it a minor injury, an environmental concern or something that could cause damage? A risk matrix is a tool to judge the likelihood and severity of harm, based on a criterion that includes:
- Severity – The degree or amount of expected loss
- Likelihood – How likely that the loss will occur
- Risk Rating – The probability and severity of the risk before and after control actions are taken Below is a risk matrix example:
Almost
Certain
Very Likely
Likely
Unlikely
Improbable
Likelihood
Minor Low Medium High Major Severity
| 5 | 10 | 20 | 25 |
| 4 | 12 | 16 | 20 |
Red = High
Yellow = Medium
Green = Low
This five-point (5×5) matrix estimates the likelihood (probability) and severity (consequence) within the five descriptive levels. Rating definitions appear, below.
“For every hazard identified during an inspection and for each associated activity, it’s important to ask the question “what if?”
Likelihood Scale Rating Score Qualitative Element Definition
0 None No injury or illness, damage, sickness or other loss is possible.
1 Minor, Minor injury, illness or loss is possible (e.g., light cuts, scratches, insignificant damage to property).
2 Low Significant injuries or illnesses are possible (e.g., sprains, bruises, lacerations and events needing medical care).
Damage to property or process.
3 Medium Temporary disability is possible (e.g., fractures, finger amputation). Lost work days due to injury or illness; substantial damage or loss of property or process.
4 High Permanent disability is possible (e.g., significant loss of movement, loss of limb, sight or hearing).
5 Major Causing death to one or more people. Loss or damage is such that it could cause serious business disruption (e.g., major fire, explosion or structural damage).
Rating Score Qualitative Element Definition
0 Impossible No injury or illness, damage or other loss is possible.
1 Improbable Loss, injury or illness could only occur under freak conditions. The situation is well managed, and all reasonable precautions have been taken.
2 Unlikely This situation is generally well managed. However occasional lapses could occur. This also applies to situations where people are well trained and required to behave safely to protect themselves.
3 Likely Insufficient or substandard controls in place. The loss is
unlikely during normal operations. However, it may occur in emergencies or non-routine conditions.
4 Very Likely Serious failures in management controls exist. The effects of human behavior or other factors could cause an accident but are usually supported by this additional factor (e.g., ladder not appropriately secured, process upset, oil spilled on the floor, poorly trained personnel).
5 Almost Certain Absence of management controls. If conditions remain unchanged, there is nearly 100 percent certainty that an accident will happen (e.g., broken rung on a ladder, live exposed electrical conductor).
Severity Scale 5 Hierarchy of Controls
Coupled with the risk assessment and risk matrix described above, Safety Projects International Inc President of Health and Safety recommends the application of a widely accepted approach called a hierarchy of controls. He describes it as a simple-to-understand process that’s useful in gauging the control appetite of an organization. It should serve as an overarching methodology for how to deliver the right level of program control for job safety and job hazard management.
Disclaimer:
This material provided by Safety Projects International Inc is for informational purposes only. The material may include notification of regulatory activity, regulatory explanation and interpretation, policies and procedures, and best practices and guidelines that are intended to educate and inform you about EHSQ topics of general interest. Opinions are those of the authors, and do not necessarily reflect the opinion of Safety Projects International Inc.
The material is intended solely as guidance and you are responsible for any determination of whether the material meets your needs. Furthermore, you are responsible for complying with all relevant and applicable regulations. We are not responsible for any damage or loss, direct or indirect, arising out of or resulting from your selection or use of the materials. Academic institutions can freely reproduce this content for educational purposes.
BIO:
Dr Bill Pomfret; MSc; FIOSH; RSP. FRSH;
Founder & President.
Safety Projects International Inc, &
Dr. Bill Pomfret & Associates.
26 Drysdale Street, Kanata, Ontario.K2K 3L3.
www.spi5star.com pomfretb@spi5star.com
Tel 613-2549233