 Abstract
Software development and maintenance outsource contracts may lead to conflicts between the client and the service organization. For a significant number of disputes, the conflict may reach the point of litigation for breach of contract. The author and his colleagues are often commissioned to perform independent assessments of contract software projects. We are also engaged as expert witnesses in litigation associated with breach of software contracts.
The problems that lead to litigation are remarkably similar from case to case. The clients charge that the development group has failed to meet the terms of the contract and failed to deliver the software on time, fully operational, or with acceptable quality. The vendors charge that the clients have changed the terms of the agreement and expanded the original work requirements. The root cause of these disputes can be traced to misunderstandings and ambiguous terms in the original contract. Independent assessments coupled with improved forms of software development contract based on function point metrics shows promise for minimizing the chances of conflict and litigation.
Capers Jones, VP and CTO
Namcook Analytics LLC
Capers.Jones3@gmail.com
Copyright 2023 by Capers Jones – All Rights Reserved
TABLE OF CONTENTS
Introduction
Why Do Large Outsource Software Projects Fail?
The Roots of Conflict in Software Development Contracts
Minimizing the Risk of Software Conflict and Litigation
Sizing Software Deliverables
Formal Software Cost Estimation
Controlling Creeping User Requirements
Joint Application Design (JAD)
Prototypes
Change Control Boards
Configuration Control Tools
Contractual Recognition of Changing Requirements
Sliding Scale of Function Point Costs
Tracking progress and problems
Function Points and Tax Litigation
Independent Assessments of Software Contracts and Projects
Including Quality Requirements in Software Contracts
Achieving High Quality and Excellence in Defect Removal
Baselines and Productivity or Quality Improvement Agreements
Summary and Conclusions
Suggested Readings
Appendix 1: Spreadsheet of Litigation Factors
INTRODUCTION
Software development and maintenance have been troublesome technologies for more than 70 years. When actual results are compared to the desired and originally anticipated results, many large software projects tend to run late, to exceed their budgets, or even to be canceled without being completed at all. The one-year delay in the opening of the new Denver International Airport because the software controlling the luggage handling system was not fully debugged illustrates the very real hazards of large software projects.
As the 21st century unfolds, an increasingly large number of organizations are moving toward outsourcing or the use of contractors for development or maintenance (or both) of their software applications. Although the general performance of outsourcing vendors and contract software development organizations is better than the performance of the clients they serve, it is not perfect.
When software is developed internally within a company and it runs late or exceeds its budget, there are often significant disputes between the development organization and the clients who commissioned the project and are funding it. Although these internal disputes are unpleasant and divisive, they generally do not end up in court under litigation.
When software is developed by a contractor and runs late or exceeds the budget, or when it is delivered in less than perfect condition, the disputes have a very high probability of moving to litigation for breach of contract. From time to time, lawsuits may go beyond breach of contract and reach the point where clients charge fraud.
As international outsourcing becomes more common, some of these disputes involve organizations in different countries. When international laws are involved, the resolution of the disputes can be very expensive and protracted.
The author and his colleagues at Namcook Analytics LLC have often commissioned to perform independent assessments of software projects where there is an anticipation of some kind of delay, overrun, or quality problem. We are sometimes engaged to serve as expert witnesses in lawsuits involving breach of contract between clients and software contractors. We have also been engaged to work as experts in software tax cases.
From participating in a number of such assessments and lawsuits, it is obvious that most cases are remarkably similar. The clients charge that the contractor breached the agreement by delivering the software late, by not delivering it at all, or by delivering the software in inoperable condition or with excessive errors.
The contractors, in turn, charge that the clients unilaterally changed the terms of the agreement by expanding the scope of the project far beyond the intent of the original agreement. The contractors also charge some kind of non-performance by the clients, such as failure to define requirements or failure to review delivered material in a timely manner.
The fundamental root causes of the disagreements between clients and contractors can be traced to two problems:
- Ambiguity and misunderstandings in the contract itself.
- The historical failure of the software industry to quantify the dimensions of software projects before beginning them.
Although litigation potentials vary from client to client and contractor to contractor, the overall results of outsourcing within the United States approximates the following distribution of results after about 24 months of operations, as derived from observations among our clients:
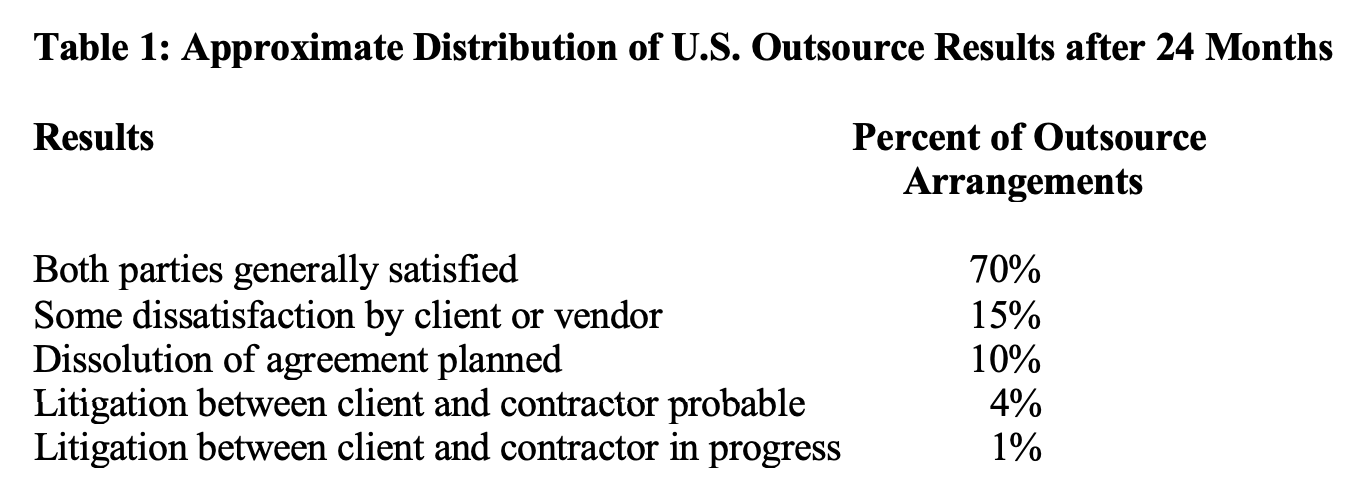
From process assessments performed within several large outsource companies, and analysis of projects produced by outsource vendors, our data indicates better than average quality control approaches when compared to the companies and industries who engaged the outsource vendors.
However, our data is still based on samples of only about 3600 outsource projects as of 2023. Our main commissioned research in the outsource community has been with clients of the largest outsource vendors in the United States such as Accenture, CSC, EDS, IBM, Keane, Lockheed, and others in this class. There are many other smaller outsource vendors and contractors where we have encountered only a few projects, or sometimes none at all since our clients have not utilized their services.
Software estimating, contracting, and assessment methodologies have advanced enough so that the root causes of software outsource contracts can now be overcome. Software estimation is now sophisticated enough so that a formal estimate using one or more of the 50 commercial software estimation tools in conjunction with software project management tools can minimize or eliminate unpleasant surprises later due to schedule slippages or cost overruns. Indeed, old-fashioned purely manual cost and schedule estimates for major software contracts should probably be considered an example of professional malpractice. Manual estimates are certainly inadequate for software contracts or outsource agreements whose value is larger than about $500,000.
A new form of software contract based on the use of function point metrics is clarifying the initial agreement and putting the agreement in quantitative, unambiguous terms. This new form of contract can also deal with the impact of creeping user requirements in a way that is agreeable to both parties.
For major software contracts involving large systems in excess of 10,000 function points, independent assessments of progress at key points are also useful.
WHY DO LARGE OUTSOURCE SOFTWARE PROJECTS FAIL?
Experts on both sides of software breach of contract litigation agree that large software projects fail more often than they succeed. It is useful to understand why this unfortunate situation occurs. As of 2023 the author has served as an expert witness in about 16 breach of contract and/or fraud cases involving software vendors and clients. It is significant that twelve of these 15 cases involved software projects that were roughly 10,000 function points in size, or larger. It is useful to summarize the observed problems noted during litigation for projects in the nominal 10,000 function point size range:
First, software development is not a licensed profession and there is no easy way for potential clients of software outsource vendors to judge whether the vendor can actually do the work that is out for contract. In general, the clients must rely upon the representations of the vendors, augmented by background checks with prior clients.
(In recent years approaches have been developed for ensuring that software outsource contractors are probably qualified to do the work, although these approaches are not yet universal. The non-profit Software Engineering Institute (SEI) located at Carnegie Mellon University has developed a five-point “capability maturity model” (CMM) for judging the professional excellence of software development teams.
Organizations are ranked on this five-point CMM scale by means of on-site audits by teams of licensed auditors. The Department of Defense has instituted a policy that only allows companies ranked at level 3 or higher on the CMM to bid on military software contracts.
Although the CMM assessment method appears to be fairly successful in selecting qualified contractors, the CMM approach was developed in a military and defense context and is not yet widely used as a method for evaluating civilian outsource vendors.)
Second, even though background checks of vendors indicate a track record of success, those successes may have been for totally different kinds of software than the application that is up for bid. A vendor might have been successful in building small applications below 100 function points in size, but prove to be marginal for larger applications of 1000 function points in size, and quite unable to handle really large applications of 10,000 function points or more. Make no mistake about it: building a 10,000 function point system is not an easy task. There are hundreds of ways that lead to failure, and only a few ways that lead to success.
Third, the outsource business is quite competitive. Therefore outsource vendors may have a temptation to exaggerate their capabilities in order to get business. There is no easy way for potential clients to distinguish between legitimate performance claims and marketing hype. This is true in other competitive fields besides software, of course.
Fourth, for large applications user requirements are always uncertain and ambiguous. Because this situation is the norm, successful projects must be very thorough in how the initial requirements are gathered and analyzed. Successful projects must also expect that new and changing requirements will occur in a continuous stream.
After the requirements are initially analyzed, the volume of new and changing requirements will run between 1% and 3% of the original requirements every month for as long as a year. The total volume of these secondary requirements can exceed 50% of the initially defined requirements at the high end of the spectrum. Creeping requirements in the range of 25% of the volume of original requirements are common. Successful vendors must expect this situation and be prepared to deal with it.
State of the art requirements gathering and analysis techniques can reduce the volume of secondary requirements significantly. In the best case, the monthly influx of new requirements can be only a fraction of one percent and the total volume of new requirements can be less than 10% of the volume of the original requirements.
If the work of gathering and analyzing initial user requirements is done in a hasty or careless fashion, the project will seem to be on schedule at first or even ahead of schedule. But later requirements changes will be difficult to absorb and the project will start to fall behind. Although the vendor may blame the client for these requirements changes, in reality the problem is because the methods used to gather and analyze the initial requirements were flawed.
Fifth, after the user requirements are analyzed, both design and coding activities are hazardous undertakings for the inexperienced. Software design and software development are very error prone. For an application of a nominal 10,000 function points in size, about 10,000 design errors and almost 20,000 coding errors comprise the current U.S. average as published in several of my books. Inexperienced development teams can easily double these average values. However, expert teams can build software with less than half of the average values.
For large software applications, the primary cause of both schedule delays and cost overruns is due to the time and effort required to find and fix bugs or errors. Unfortunately, if these errors are not discovered until testing begins it is too late to get the project back on track. Design errors are much more difficult to repair than coding errors, so that projects that are not designed well may not even be repairable. Therefore formal design and code inspections prior to testing are key activities for successful large software projects.
Projects that bypass design and code inspections may seem like they are ahead of schedule until testing begins. When testing begins, a deluge of unexpected errors will essentially bring the project to a standstill. The development team will get locked into a cycle of finding bugs, attempting to fix them, and retesting that can stretch out for months. Even worse, about 10% of the defect repairs will be “bad fixes” that accidentally inject new defects into the application.
(In the 1960’s IBM discovered that software defects are not randomly distributed through all of the modules of large applications. Instead, defects tend to clump in a small number of troublesome modules IBM called “error prone” modules. In some cases, less than 5% of the modules in an application receive more than 60% of the total volume of reported defects. These error-prone modules are often high in complexity and difficult to repair safely. The number of bad-fixes noted for error-prone modules exceeds 20%, and in extreme cases can approach 100%. That is, every attempt to fix a defect in an error-prone may add a fresh defect.)
Many cancelled outsource projects are terminated after testing has stretched out for six to nine months longer than initially planned. The most obvious reason for termination is that the accumulated cost overruns and schedule delays have reduced the return on investment (ROI) of the application. Indeed, the ROI may even turn negative for projects that are seriously out of control.
Sixth, there are no methods of removing software defects or errors that are 100% effective. Formal design and code inspections average about 65% in defect removal efficiency. Most forms of testing are less than 30% efficient in that they find and remove less than 1 defect out of every 3 defects actually present. The current U.S. average in finding software defects before delivery to clients is only about 85%. A combination of formal design and code inspections plus a multi-stage testing series can top 95% in cumulative defect removal efficiency. This kind of information on defect removal efficiency has been published in several of my books, such as a chapter entitled “Defect Removal Efficiency”(pages 165-173) appearing in Software Quality – Analysis and Guidelines for Success, International Thomson Computer Press, 1996.
IBM discovered many years ago that projects topping 95% in defect removal efficiency had shorter schedules and lower costs than those below 85%. This is because the effort to find and fix defects is greater late in the development cycle than it is early in the development cycle. Therefore successful large software projects are very proactive with design and code inspections, since only formal inspections plus formal testing can top 95% in overall defect removal efficiency.
An interesting sign that an outsource vendor is capable of handling large applications is if they utilize state of the art quality control methods. The state of the art for large software applications includes sophisticated defect prediction methods, measurements of defect removal efficiency, utilization of defect prevention methods, utilization of formal design and code inspections, presence of a Software Quality Assurance (SQA) department, use of testing specialists, and usage of a variety of quality-related tools such as defect tracking tools, complexity analysis tools, debugging tools, and test library control tools.
In summary form, successful software projects in the 10,000 function point class usually are characterized by these attributes:
- Less than 1% monthly requirements change after the requirements phase
- Less than 1% total volume of requirements “churn”
- Less than 5.0 defects per function point in total volume.
- More than 65% defect removal efficiency before testing begins.
- More than 96% defect removal efficiency before delivery.
In summary form, unsuccessful software projects in the 10,000 function point class usually are characterized by these attributes:
- More than 2% monthly requirements change after the requirements phase
- More than 5% total volume of requirements churn
- More than 6.0 defects per function point in total volume.
- Less than 35% defect removal efficiency before testing begins.
- Less than 85% defect removal efficiency before delivery.
In performing “autopsies” of cancelled or failed projects it is fairly easy to isolate the attributes that distinguish disasters from successes. Experienced project managers know that false optimism in estimates, failure to plan for changing requirements, and inadequate quality approaches lead to failures and disasters. Conversely, accurate estimates, careful change control, and top-notch quality control are stepping stones to success.
The difference between requirements “change” and requirements “churn” is whether or not the changes adds to the function point total of the application. Requirements changes do add to the function point totals, and hence are easily measured for costing purposes. Requirements churn, on the other hand, are updates that do not change the function point totals, such as redesigning the format of a report without adding any new fields. Churn is harder to measure than change.
THE ROOTS OF CONFLICT IN SOFTWARE DEVELOPMENT CONTRACTS
Software development has been a difficult technology for many years. Compared to almost any other manufactured object, software development requires more manual labor by skilled craftsmen.
Further, many software applications are designed to automate manual activities that were not often fully understood by clients in sufficient detail. Therefore as software development proceeds, new requirements and new features tend to occur in a continuous stream.
Software contracting practices have often been highly ambiguous in determining the sizes of various deliverables, development schedules, and other quantitative matters. More often than not, the contract would deal only in generalities or discuss only part of the situation such as the number of staff to be applied. Unfortunately, most software development contracts contain insufficient language and clauses for dealing with changes in the requirements during development.
The most common root cause of contract litigation where we have been expert witnesses are new or changed requirements added by clients after the basic contract has been signed and agreed to. The clients think these new requirements should be included in the original agreement while the contractor thinks they should be funded separately. Unfortunately, the contract itself is usually ambiguous as to how new requirements should be handled, and hence the contract itself adds to the probability of conflict and litigation.
Finally, although effective software quality control is now technically possible, quality is seldom part of software contracts and tends to be ignored until the software is delivered whereupon the clients may be dismayed and disturbed. It would be much more effective to include quality clauses in the contract itself.
Software management consultants have something in common with physicians: both are much more likely to be called in when there are serious problems rather than when everything is fine. Examining large software systems that are in trouble is a very common assignment for management consultants.
Unfortunately, the systems are usually already somewhat late, over budget, and showing other signs of acute distress before the consulting study begins. The consulting engagements, therefore, are aimed at trying to correct the problems and salvage the system, if indeed salvage is possible.
Table 2 shows the approximate frequency of various kinds of outcomes, based on the overall size of the project being attempted. Table 2 is taken from the author’s book, Patterns of Software Systems Failure and Success (International Thomson Press, 1995).
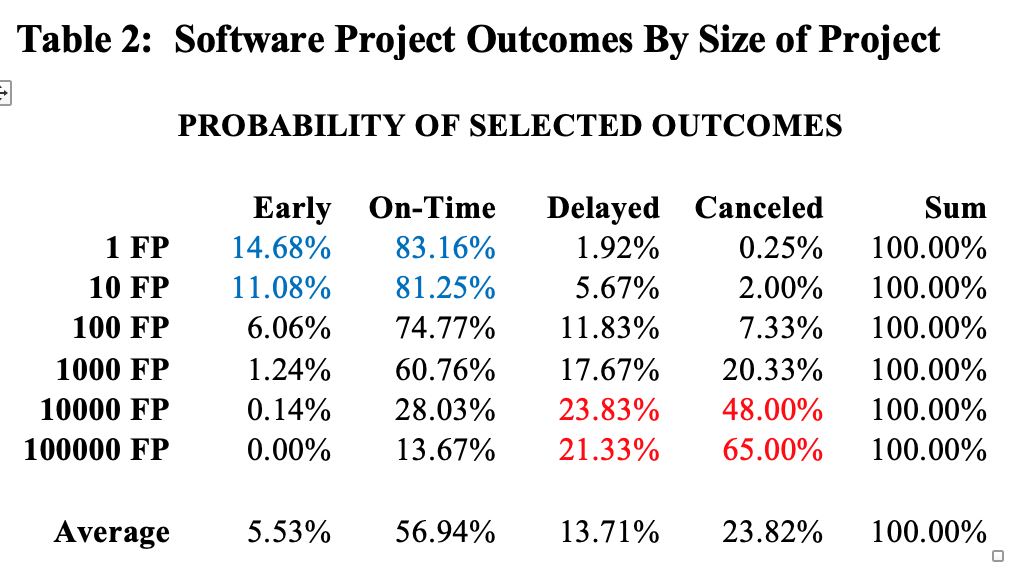
As can easily be seen from table 2 small software projects are successful in the majority of instances, but the risks and hazards of cancellation or major delays rise quite rapidly as the overall application size goes up. Indeed, the development of large applications in excess of 10,000 function points is one of the most hazardous and risky business undertakings of the modern world.
Given the very common and serious problems with large software projects, it is not a surprise that most of the litigation that SPR and the author have been involved with were for projects in the 10,000 function point size range. The smallest project where we have worked as experts in a breach of contract case was roughly 4000 function points in size.
The specific factors that most often trigger litigation are major schedule slips and major cost overruns, with claims of poor quality also being common. Although the word “major” has no precise definition, the usual project cited in lawsuits is more than 12 calendar months late and more than 50% more expensive than planned at the time the project is terminated or the litigation is filed.
Of all the troublesome factors associated with software, schedule slips stand out as being the most frequent source of litigation between outsource vendors and their clients. Table 3 shows approximate U.S. software development schedules in calendar months for six size ranges and for six kinds of software project: end-user development; management information systems, outsource projects, commercial software, system software, and military software. Table 3 is taken from the author’s book Applied Software Measurement (McGraw Hill 2008).
The schedules shown here run from the nominal “start of requirements” up to the nominal “first customer ship” date of software projects. The starting point of software projects is usually ambiguous and difficult to determine. The starting points used in table 3 were simply derived by querying the responsible project managers. Delivery dates are sometimes ambiguous too. The assumption in table 3 is for delivery to the first paying customer, rather than delivery to Beta Test or Field Test customers.
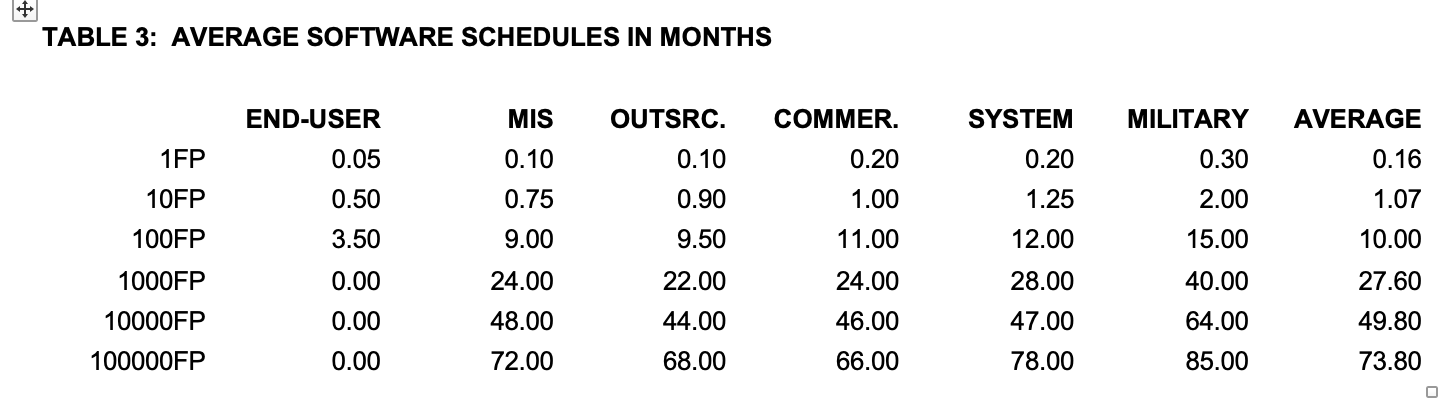
Software schedules, like staffing patterns, are highly variable. In part, schedules are determined by the number of personnel assigned, in part by the amount of overtime (both paid and unpaid), in part by the volume of creeping user requirements, and in part by the tools, technologies, and languages utilized.
The most troublesome aspect of software schedules is the major difference between the actual schedules of software projects, and the anticipated or desired schedules as determined by clients or senior executives.
Figure 1 illustrates the typical pattern of differences between the initial schedule established for the project during requirements, and the final delivery of the software. Note how the gap between anticipation and reality grows steadily wider as the overall sizes of the applications increase in size and complexity. Thus Figure 1 illustrates the most common source of litigation between outsource vendors and clients: the gap between anticipation and reality.
Figure 1 represents what is probably the most severe and chronic complaint about software from corporate executives and high government and military officials: large systems are often later than requested. They are often later than when the software managers promised too, which is one of the reasons why the software management community is not highly regarded by senior executives as a rule.
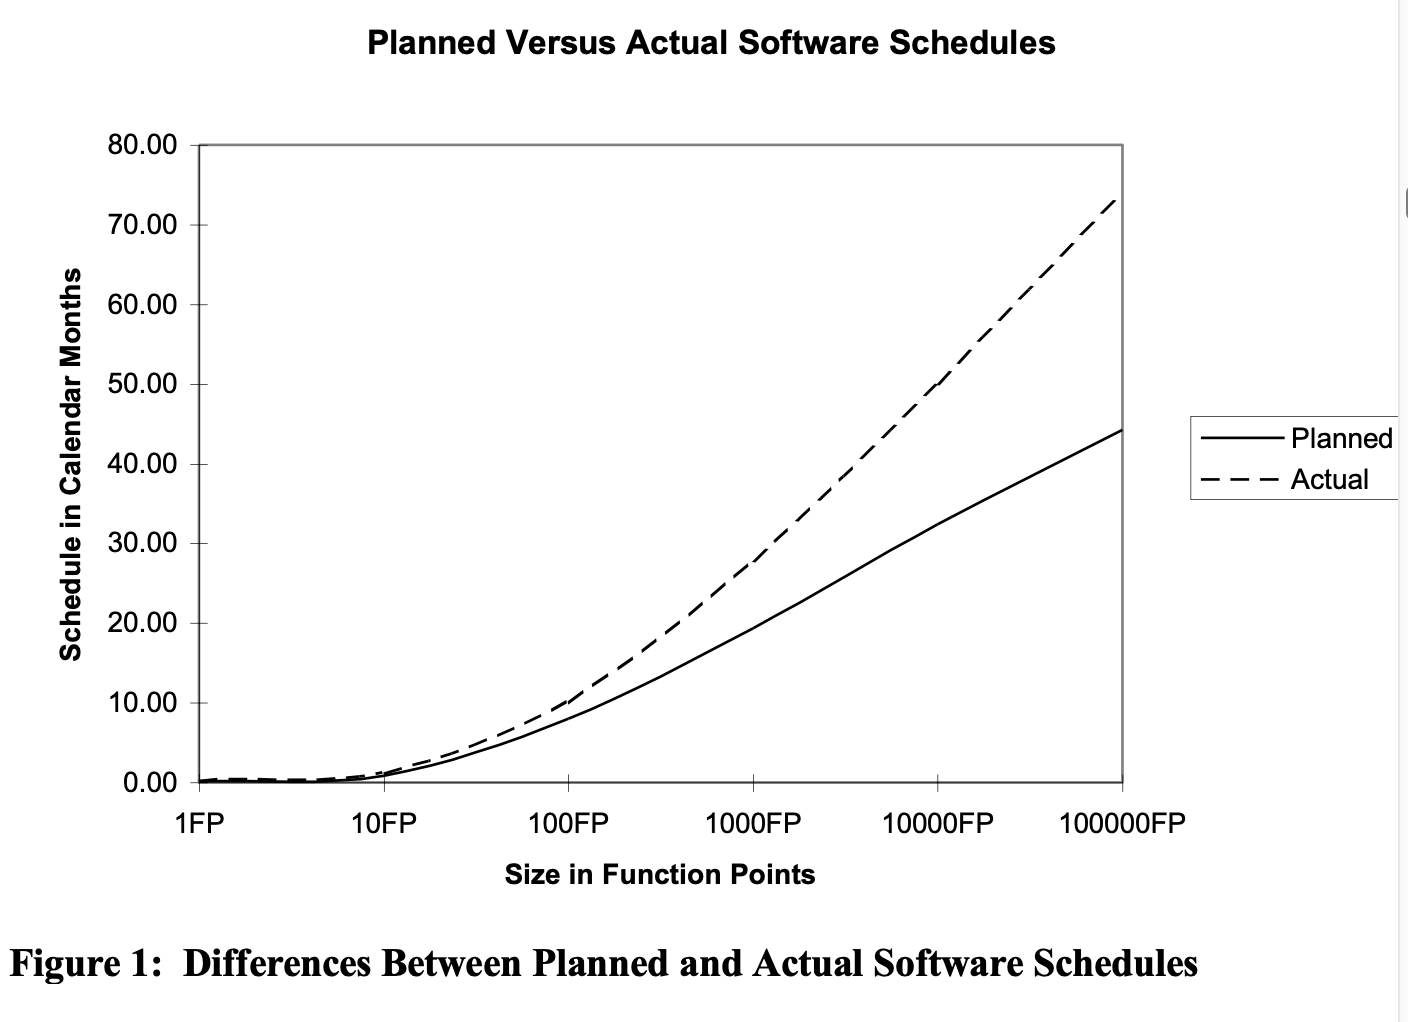
The large gap between the actual delivery date and the anticipated delivery date is the cause of more friction between the software world, corporate executives, and clients than any other known phenomenon. This gap is also the cause of a great deal of expensive litigation.
One of the factors that explain this gap is creeping user requirements. However, a problem of equal severity is inadequate techniques in the way the original schedule estimates were developed. Often schedules are set by arbitrary client demand, or external criteria, rather than being carefully planned based on team capabilities. Arbitrary schedules that are preset by clients or executives and forced on the software team are called “backwards loading to infinite capacity” in project management parlance.
The contractors and outsource companies are often in competitive bids with other vendors. Each competitor knows that if they reject the client’s arbitrary schedule demands, one of the other competitors’ might get the contract. Thus competitive bidding often triggers the hazardous practice of contractors accepting arbitrary schedule or cost criteria that are unachievable.
There is no easy solution to the practice that competitive bidding leads vendors into situations that are outside the range of the current software state of the art. What might improve the situation would be the availability of empirical data that showed software schedules, effort, costs, and cancellation rates for various sizes and kinds of software. If this data were created by a non-profit or independent organization, then both vendors and clients could have some way of ascertaining whether a desired application can or cannot be accomplished in the time desired. However, as of 2023 this kind of objective empirical data is just beginning to become available. The International Software Benchmark Standards Group (ISBSG) was founded in 1997. Now that it has been operational for more than 20 years, the volume of data has reached about 15,000 software projects. Thus ISBSG data is now available for a large portion of information technology products. The ISBSG data is less complete for military and systems software. From reviewing the ISBSG data, it is generally close to author’s own published data, and also reasonably close to other published sources as well.
Besides ISBSG there are a number of software benchmark data bases, but these are usually proprietary and not generally available. While some of this data is generally available in books such as the author’s Applied Software Measurement (McGraw Hill, 2008), Software Assessments, Benchmarks, and Best Practices (Addison Wesley 2000), and Estimating Software Costs (McGraw Hill 2007) it is not a common practice for either vendors or clients to utilize published data during the bidding process. Indeed, the most common use of such published data is during litigation when the software project has been cancelled or delayed.
Although changing requirements are troublesome, they are so common that every major software contract needs to include methods for dealing with them. A fundamental root cause of changing requirements is because software applications are expanding the horizon of the ways companies operate. In a sense, the creation of software requirements is reminiscent of hiking in a fog that is gradually lifting. At first only the immediate surroundings within a few feet of the path are visible, but as the fog lifts more and more of the terrain can be seen.
The function point metric has proven to be a useful but not perfect tool for exploring the impact and costs of creeping requirements. Recall that the function point metric is a synthetic metric derived from five external attributes of software systems:
1 Inputs
2 Outputs
3 Inquiries
4 Logical files
5 Interfaces.
The normal reason that requirements grow or creep is that one or more of the five attributes also associated with function points are growing. The single most common growth factor comprises the needs for additional outputs, but any of the five function point elements can and do expand as software projects proceed through development.
In the context of exploring creeping requirements, the initial use of function point metrics is simply to size the application at the point where the requirements are first considered to be firm. At the end of the development cycle, the final function point total for the application will also be counted.
For example, suppose the initial function point count is for a project of 1000 function points, and at delivery the count has grown to 1250. This provides a direct measurement of the volume of “creep” in the requirements.
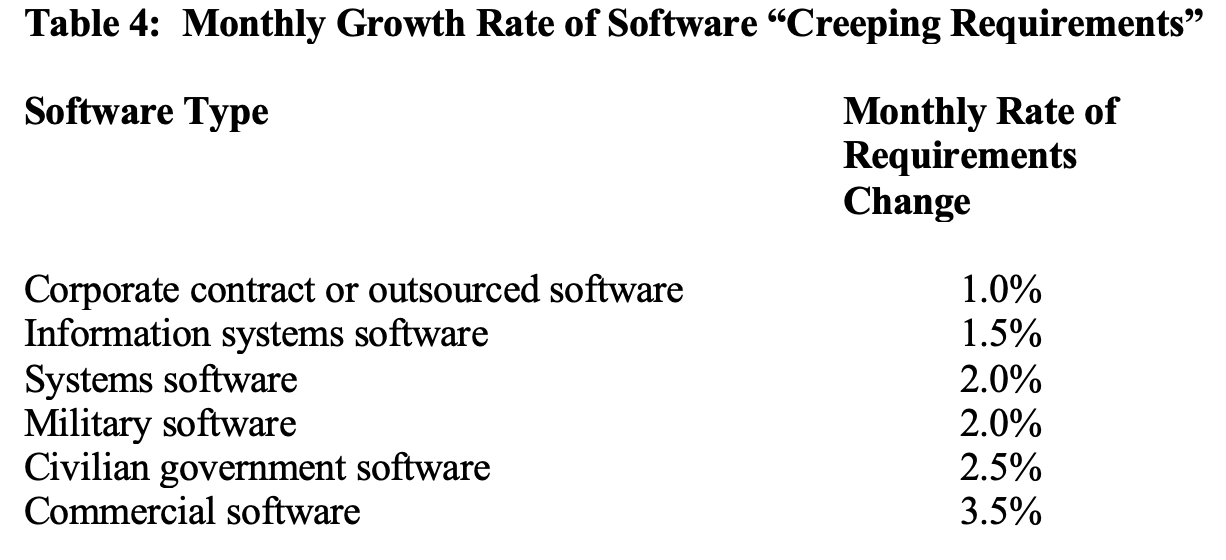
From analysis of the evolution of requirements during the development cycle of software applications, it is possible to show the approximate rates of monthly change. The changes in table 4 are shown from the point at which the requirements are initially defined through the design and development phases of the software projects.
Table 4 is derived from the use of function point metrics, and the data is based on differences in function point totals between: A) The initial estimated function point total at the completion of software requirements; B) The final measured function point total at the deployment of the software to customers.
If the first quantification of function points at requirements is 1000 function points and the final delivered number of function points is 1120, that represents a 12% net growth in creeping requirements. If the time span from completing the requirements through the design and code phases is a 12 month period, then it can be seen that the rate of growth in creeping requirements averages 1% per month.
In table 4, the changes are expressed as a percentage change to the function point total of the original requirements specification. Note that there is a high margin of error, but even so it is useful to be able to measure the rate of change at all:
In recent years, methodologies such as Agile and Extreme (XP) have added actual client representatives to development teams. These methodologies build prototypes for major features suggested by the client, and then convert them into the final application. Under Agile methods with an on-board client representative, requirements changes can top 10% per calendar month.
It is interesting that although rate of change for contract software is actually less than many other kinds of applications, the changes are much more likely to lead to disputes or litigation. The data in these tables is derived from the author’s book Patterns of Software Systems Failure and Success (International Thomson Press, 1995).
Two forms of changing requirements occur, and both are troublesome for software contracts. The most obvious form of change are new features. Here the function point metric can show the exact rate of growth.
But a second form of change is more subtle and difficult to evaluate. Suppose the client is dissatisfied with the appearance of various screens and reports produced by an early version of a contracted software application. The client might ask for changes in the layouts and appearance of the screens and reports, but this demand does not change the function point total of the application since nothing new is being added.
There is no perfect way of dealing with requirements “churn” as opposed to requirements “creep” or adding new features. However if the function point totals of the original screens and reports are known, approximations of the changes are possible. Suppose that a particular screen originally required 10 function points and half of the fields are being updated due to a change in user requirements. It is reasonable to assess this change as being equivalent to about 5 function points.
Another way of dealing with requirements churn involves “backfiring” or direct conversion from source code statements into equivalent function points. Suppose the application is written in the COBOL programming language. The average number of COBOL statements in the procedure and data divisions to implement 1 function point is about 106.7 logical source code statements.
Thus if the original screen required 1000 COBOL source code statements and the change involved modification to 500 of them, then the requirements churn would be roughly equivalent to 5 function points.
Because the measurement of requirements “churn” is more difficult than requirements “creep” or new features, it is difficult to ascertain the exact volumes of such changes. However in several recent breach of contract lawsuits, the approximate volume of “churn” was about twice that of “creep” or adding new features. The combined total of creep and churn together can exceed 2% per calendar month during the phases of design and coding. The total volume of creep and churn can top 30% of the original requirements in the 18 month period following the nominal “completion” of the initial requirements. This rate does not occur often, but the fact that it can occur at all implies a need for careful requirements analysis and effective change management tools and methods.
MINIMIZING THE RISK OF SOFTWARE CONFLICT AND LITIGATION
In order to minimize or eliminate the risk that major software contracts will end up in dispute or in court, it is obvious that the root causes must be attacked:
- The sizes of software contract deliverables must be determined during negotiations, preferably using function points.
- Cost and schedule estimation must be formal and complete.
- Creeping user requirements must be dealt with in the contract in a way that is satisfactory to both parties.
- Some form of independent assessment of terms and progress should be included.
- Anticipated quality levels should be included in the contract.
- Effective software quality control steps must be utilized by the vendor.
- If the contract requires that productivity and quality improvements be based on an initial baseline, then great care must be utilized in creating a baseline that is accurate and fair to both parties.
- Tracking of progress and problems during development must be complete and not overlook or deliberately conceal problems.
Fortunately, all eight of the root causes of software conflict and contract litigation are now amenable to control.
Sizing Software Deliverables
You would not sign a contract to build a house without knowing how many square feet it will contain. Neither clients nor contractors should enter into development agreements without formal sizing of the work to be performed. Indeed, the best method of minimizing downstream risks is to determine the function point total of the application during the initial contract negotiations.
A strong caution should be given: Entering into a fixed-price contract for work of indeterminate size is a very hazardous undertaking. Imagine the consequences of entering into a fixed-price contract to build a home without any solid architectural specifications or even a firm idea of how many square feet the house is to contain! Of course, home construction is not usually a fixed-price undertaking, for obvious reasons.
If the negotiations are to be completed before software requirements are firm, it is still possible to include contractual clauses to the effect that, “Software sizes based on function point metrics will be determined by utilization of neutral certified function point counting specialists within six months” or something similar.
The function point metric is now the preferred metric throughout the world for sizing complete software projects, and all other kinds of software deliverable items: paper documents such as specifications and user manuals, source code for any known programming language, user manuals, and test cases.
The earliest point at which function point totals have been derived with certainty is at the completion of the requirements phase. However pattern matching can move the effective estimation point perhaps 6 to 12 months earlier
For legacy applications that are being modified, Relativity Technologies has developed a method of analyzing existing applications and extracting data that can produce function point totals equivalent to IFPUG function points in a matter of minutes. However this method works only for COBOL and perhaps a dozen common languages.
If the contract is to include development of the requirements themselves, then the final total will not be known exactly at the time the contract discussions are initiated. However, the use of “cost per function point” as part of the contract will clarify the overall situation.
Even before requirements are fully defined, there are several useful approximation methods based on function points that can be helpful. One approximation method is based on pattern matching concepts, which is a feature of the author’s Software Risk Master (SRM) estimation tool. This tool not only predicts application size, but also the odds of litigation occurring and even the probable costs for the plaintiff and defendant if the case goes to trial.
For software applications of significant size ranges, such as those > 1000 function points, the outputs are usually the first item known or defined during the requirements phase, and the other function point elements are gradually defined over a period of a few months. The following list in table 5 shows the usual sequence:
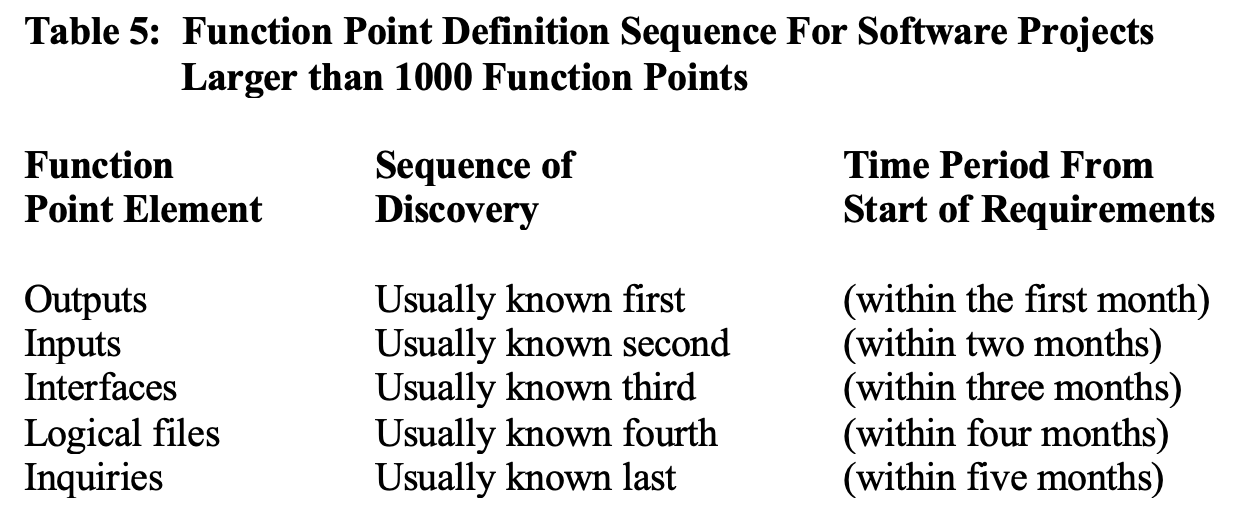
If any one of the five function point elements is known or guessed at, the missing elements will be approximated by scanning the knowledge base and extracting projects whose patterns are similar. Of course, this is not particularly accurate, but it does allow for very early sizing long before the true count of function points can be developed.
The overall accuracy of pattern matching logic varies based on how many of the five function point parameters are known with certainty:
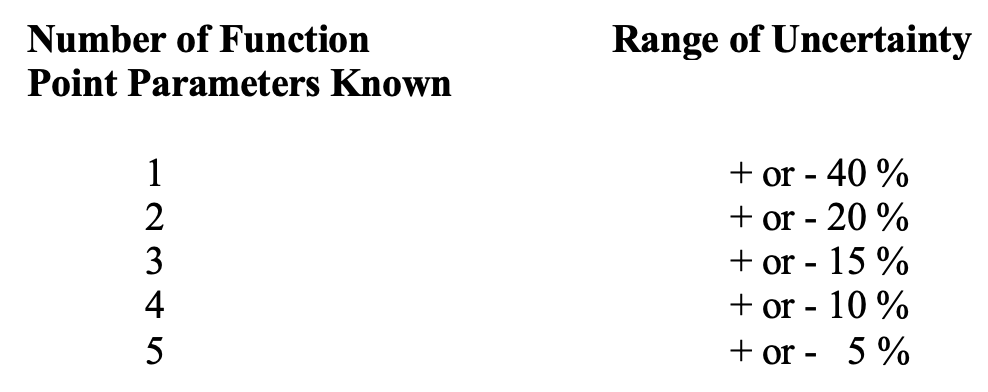
The accuracy improves as more and more of the function point factors are determined. The advantage of this form of approximation is that it begins to provide a quantitative base for contractual discussions with clients that is not just wild guess work.
A second and more recent method for exploring the possible sizes of software applications is that of “browsing” through a collection of size data derived from measured historical projects such as the collections offered by Software Productivity Research, the Davids Consulting Group, or the International Software Benchmarking Standards Group (ISBSG).
For example, the new Software Productivity Research KnowledgePLANÒ software cost estimating tool includes a browsing feature for examining software sizes. Table 6 illustrates a small sample of the kinds of size data that can now be examined as a precursor for determining the sizes of new applications:
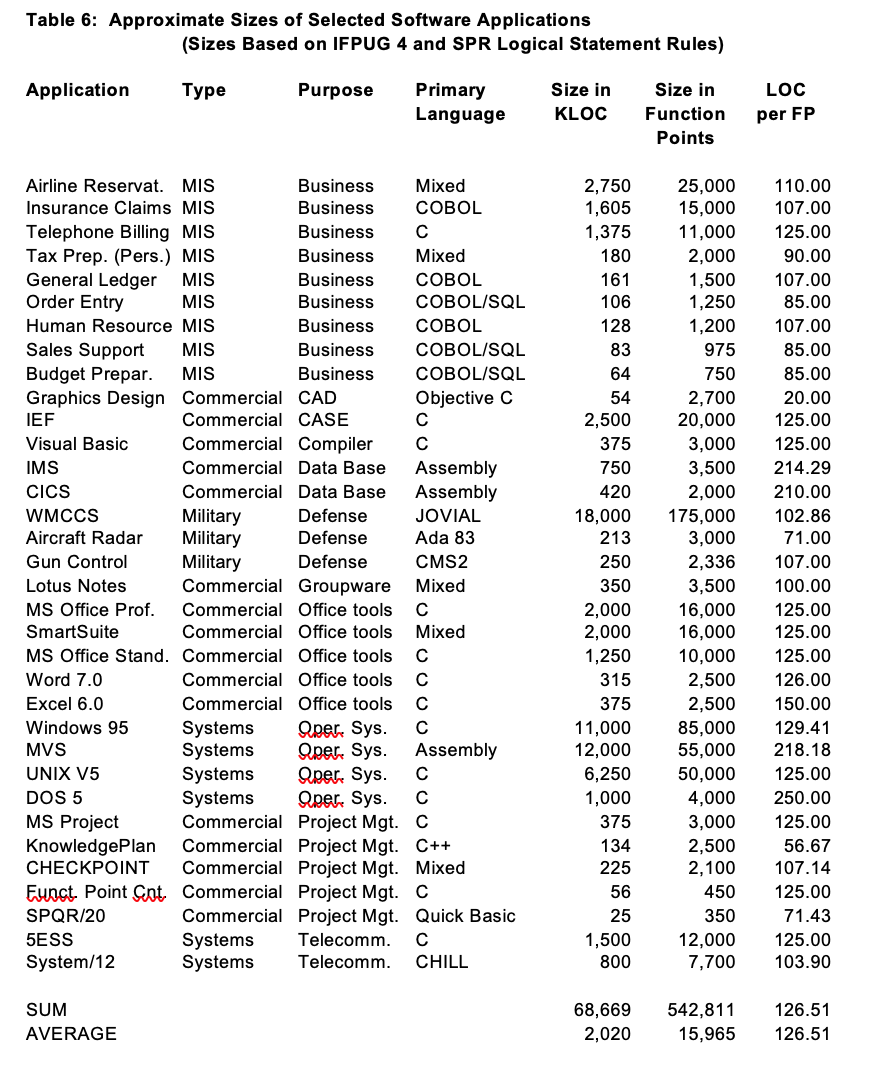
Table 6 is only a small sample. It is sorted by the third column, or the “purpose” of software, since this is a common factor which needs to be understood. However, when using the browsing capabilities of actual software cost estimating tools, more sophisticated search logic can be used. For example, the search might narrow down the choices to “only MIS applications written in COBOL” or whatever combination is relevant.
Formal Software Cost Estimation
As of 2023, there are more 10 commercial software cost estimation tools marketed in the United States, and all of them support function point metrics. The “best practice” for software estimation is to utilize one or more of these software estimation tools and have experienced managers, consultants, and technical personnel validate the estimate.
For development schedules, output from most commercial software cost estimating tools can feed directly into project management tools although many commercial estimating tools also include schedule logic and can produce approximate schedules themselves.
Informal manual cost estimates or schedule estimates should not be part of software contracts if the total value of the contract is more than about $50,000. Indeed, for software contracts whose value exceeds about $500,000 the use of manual estimating methods has a distressingly high probability of ending up in court for breach of contract.
The information shown in table 7 illustrates the basic concept of activity-based costing for software projects. It is not a substitute for one of the commercial software cost estimating tools such as the author’s Software Risk Master (SRM), CHECKPOINTâ or KnowledgePlanÒ software estimation tools that support activity-based costs in a much more sophisticated way, such as allowing each activity to have its own unique cost structure, and to vary the nominal hours expended based on experience, methods, tools, etc.
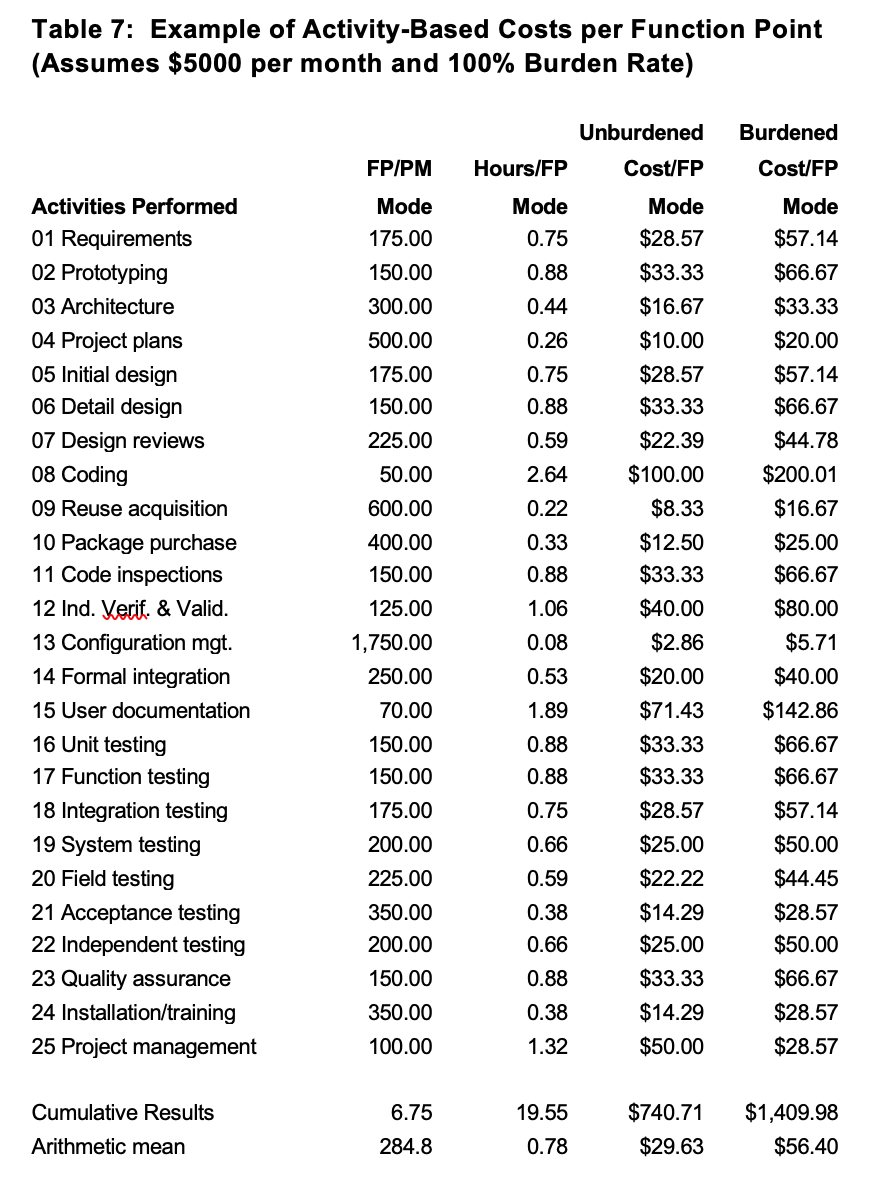
To use the following table, you need to know at least the approximate function point size of the application in question. Then select the set of activities that you believe will be performed for the application. After that you can add up the work-hours per function point for each activity. You can do the same thing with costs, of course, but you should replace the assumed costs of $5,000 per staff month and a 100% burden rate with the appropriate values from your own company or organization.
Once activity-based costing is started, it can be extended to include many other activities in a similar fashion. For example, the set of activities shown here is common for development projects. If you are concerned with maintenance of aging legacy applications, with porting software from one platform to another, or with bringing out a new release of a commercial software package than you will need to deal with other activities outside of those shown in the table.
Controlling Creeping User Requirements
Since the requirements for more than 90% of all software projects change during development, creeping user requirements is numerically the most common problem of the software industry and should not be a surprise to anyone. Indeed for software projects at or above 10,000 function points creeping requirements have been noted on 100% of all such projects to date.
A number of technologies have been developed which can either reduce the rate at which requirements change (and also churn), or at least make the changes less disruptive. Space does not permit a full discussion of each, but following are the technologies with positive value in terms of easing the stress of creeping user requirements.
Joint Application Design (JAD)
Joint application design or JAD is a method for developing software requirements under which user representatives and development representatives work together with a facilitator to produce a joint requirement specification which both sides agree to.
The JAD approach originated in Toronto, Canada in the 1970’s at the IBM software laboratory there. JAD sessions have now become very common for information systems development throughout the world. Books, training, and consulting groups that offer JAD facilitation are also very common. Compared to the older style of “adversarial” requirements development, JAD can reduce creeping requirements by almost half. The JAD approach is an excellent choice for large software contracts that are intended to automate information systems.
The use of JAD for information systems projects has the beneficial effect of generating such complete requirements that subsequent down-stream changes are usually below 1% per month.
Prototypes
Since many changes don’t start to occur until clients or users begin to see the screens and outputs of the application, it is obvious that building early prototypes can move some of these changes to the front of the development cycle instead of leaving them at the end.
Prototypes are often effective in reducing creeping requirements, and can be combined with other approaches such as joint application design. Prototypes by themselves can reduce creeping requirements by somewhere between 10% and about 25%.
Change Control Boards
Change control boards are not exactly a technology, but rather a group of managers, client representatives, and technical personnel who meet and decide which changes should be accepted or rejected. Change control boards are often encountered in the military software domain systems software domain, although they are not common for information systems. Such boards are most often encountered for large systems in excess of 10,000 function points in size.
Configuration Control Tools
Software “configuration control” refers to keeping track of all modifications to documents, source code, screens, and other deliverables. Normally an authentic original version is used to kick-off the configuration control process. This version becomes the “baseline” against which all changes are measured. Then each change is evaluated in terms of how it affects the baseline.
Changes are also evaluated in terms of how they affect all deliverables and also other changes. Configuration control is a highly complex activity, but fortunately one that is supported by some very sophisticated tools.
Configuration control is best on military projects, but is also frequently well done on large systems software projects. The management information systems domain and civilian governments tend to lag somewhat in this key activity.
Many commercial tools are available to facilitate software configuration control and change management. Which specific tool is used is not a major issue in litigation, but failure to use any change control tools at all tends to be a fairly common situation in projects undergoing litigation for delays and overruns.
Contractual Recognition of Changes in Requirements and Scope of Project
In every case where requirements changes are part of the claim, there are disputes between the client and the vendor as to whether or not specific changes are part of the basic requirements or represent new features added after the baseline requirements were created and agreed to. Often clients more or less unknowingly expand requirements by means of “clarifications” that add features when a phrase from the requirements is expressed in greater detail.
A great deal of litigation might be avoided if the terms of the contract could include phrasing that quantified exactly what topics such as “in scope” and “out of scope” really mean.
The use of function point metrics has the potential for allowing very precise quantification of requirements changes. It would be possible to include contractual clauses to the effect that at completion of requirements, both the vendor and the client would agree that a function point count would be performed on the initial requirements by one or more certified function point counters. The initial size of the application would become the baseline against which changes in requirements are measured.
Later on, as features are added or “clarified” the function point totals of each change would also be enumerated and the effort and schedule for the project adjusted accordingly.
It is obvious that using function points in this fashion for software outsource agreements will add costs and time to the beginning of the project. However, given the fact that over half of all large projects either run late or are cancelled and many end up in court, steps that raise the probability of a successful outcome without litigation will have a positive return on investment.
Using a Sliding Scale of Cost per Function Point
For software development contracts, an effective way of dealing with changing user requirements is to include a sliding scale of costs in the contract itself. For example, suppose a hypothetical contract is based on an initial agreement of $1000 per function point to develop an application of 1000 function point in size, so that the total value of the agreement is $1,000,000.
The contract might contain the following kind of escalating cost scale for new requirements added downstream:
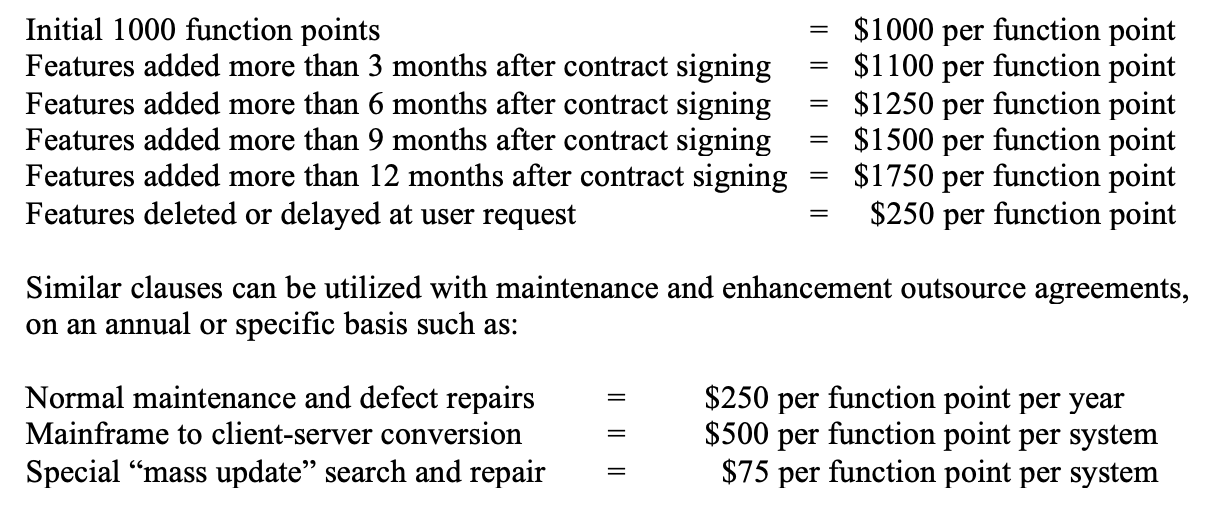
(Note that the actual cost per function point for software produced in the United States runs from a low of less than $100 per function point for small end-user projects to a high of more than $7,500 per function point for large military software projects. The data shown here is for illustrative purposes, and should not actually be used in contracts as it stands.)
The advantage of the use of function point metrics for development and maintenance contracts is that they are determined from the user requirements and cannot be unilaterally added or subtracted by the contractor.
One of the many problems with the older “lines of code” or LOC metric is that there is no objective way of determining the minimum volume of code needed to implement any given feature. This meant that contracts based on cost per LOC could expand without any effective way for the client to determine whether the expansions were technically necessary.
Function points, on the other hand, cannot be unilaterally determined by the vendor and must be derived from explicit user requirements. Also, function points can easily be understood by clients while the lines of code metric is difficult to understand in terms of why so much code is needed for any given contract.
The function point metric has led to some rather useful rules of thumb that can be applied during software requirements or as soon as the approximate total volume of function points can be ascertained. These rules are only rough approximations, but they can head off potential litigation if the client demands are too far from the average results.
- Software schedules in calendar months from requirements to delivery can be approximated by raising the function point total of the application to the 0.4 power.
- Software defect potentials or numbers of “bugs” that might be encountered can be approximated by raising the function point total of the application to the 1.25 power. This will yield the total number of bugs or errors found in five deliverables: requirements, design, source code, users manuals, and “bad fixes” or secondary defects.
- Software technical staffing for development projects can be approximated by dividing the size of the application in function points by 150. This will yield the number of analysts, programmers, technical writers, data base administrators, etc. When projects are under tight schedule constraints, the assignment scopes can drop well below 100 function points per team member.
- Software technical staffing for maintenance projects can be approximated by dividing the size of the application in function points by 1500. This will yield the number of maintenance personnel necessary to perform defect repairs and small enhancements below about 10 function points in size.
These rules of thumb can also be used by client personnel to perform initial comparisons of vendor bids. If a bid is significantly better than these rules of thumb, such as asserting a delivery schedule where the exponent would be less than the 0.3 power, then the vendor can be asked to demonstrate how such a remarkable achievement would be possible.
These rules of thumb are not a substitute for formal software cost estimates produced using modern, calibrated estimating and project management tools. However, if planned results are wildly divergent from results derived from these rules, it is a sign that the contract is in urgent need of better estimating methods.
Tracking Progress and Problems During Development
Once a software project is underway, there are no fixed and reliable guidelines for judging its rate of progress. The civilian software industry has long utilized ad hoc milestones such as completion of design or completion of coding. However, these milestones are notoriously unreliable.
Tracking software projects requires dealing with two separate issues: 1) Achieving specific and tangible milestones; 2) Expending resources and funds within specific budgeted amounts.
Because software milestones and costs are affected by requirements changes and “scope creep” it is important to measure the increase in size of requirements changes, when they affect function point totals. However there are also requirements changes that do not affect function point totals, which are termed “requirements churn.” Both creep and churn occur at random intervals. Churn is harder to measure than creep and is often measured via “backfiring” or mathematical conversion between source code statements and function point metrics.
As of 2023 there are automated tools available that can assist project managers in recording the kinds of vital information needed for milestone reports. These tools can record schedules, resources, size changes, and also issues or problems.
For an industry now more than 70 years of age, it is somewhat surprising that there is no general or universal set of project milestones for indicating tangible progress. From SPR’s assessment and baseline studies, following are some representative milestones that have shown practical value.
Note that these milestones assume an explicit and formal review connected with the construction of every major software deliverable. Formal reviews and inspections have the highest defect removal efficiency levels of any known kind of quality control activity, and are characteristics of “best in class” organizations.
Table 8: Representative Tracking Milestones for Large Software Projects
- Requirements document completed
- Requirements document review completed
- Initial cost estimate completed
- Initial cost estimate review completed
- Development plan completed
- Development plan review completed
- Cost tracking system initialized
- Defect tracking system initialized
- Prototype completed
- Prototype review completed
- Complexity analysis of base system (for enhancement projects)
- Code restructuring of base system (for enhancement projects)
- Functional specification completed
- Functional specification review completed
- Data specification completed
- Data specification review completed
- Logic specification completed
- Logic specification review completed
- Quality control plan completed
- Quality control plan review completed
- Change control plan completed
- Change control plan review completed
- Security plan completed
- Security plan review completed
- User information plan completed
- User information plan review completed
- Code for specific modules completed
- Code inspection for specific modules completed
- Code for specific modules unit tested
- Test plan completed
- Test plan review completed
- Test cases for specific test stage completed
- Test case inspection for specific test stage completed
- Test stage completed
- Test stage review completed
- Integration for specific build completed
- Integration review for specific build completed
- User information completed
- User information review completed
- Quality assurance sign off completed
- Delivery to beta test clients completed
- Delivery to clients completed
The most important aspect of table 8 is that every milestone is based on completing a review, inspection, or test. Just finishing up a document or writing code should not be considered a milestone unless the deliverables have been reviewed, inspected, or tested.
In the litigation where the author worked as an expert witness, these criteria were not met. Milestones were very informal and consisted primarily of calendar dates, without any validation of the materials themselves.
Also, the format and structure of the milestone reports were inadequate. At the top of every milestone report problems and issues or “red flag” items should be highlighted and discussed first.
During depositions and review of court documents, it was noted that software engineering personnel and many managers were aware of the problems that later triggered the delays, cost overruns, quality problems, and litigation. At the lowest levels, these problems were often included in weekly status reports or discussed at team meetings. But for the higher-level milestone and tracking reports that reached clients and executives, the hazardous issues were either omitted or glossed over.
A suggested format for monthly progress tracking reports delivered to clients and higher management would include these sections:
Suggested Format for Monthly Status Reports for Software Projects
- Status of last months “red flag” problems
- New “red flag” problems noted this month
- Change requests processed this month versus change requests predicted
- Change requests predicted for next month
- Size in function points for this months change requests
- Size in function points predicted for next month’s change requests
- Schedule impacts of this month’s change requests
- Cost impacts of this month’s change requests
- Quality impacts of this month’s change requests
- Defects found this month versus defects predicted
- Defects predicted for next month
- Costs expended this month versus costs predicted
- Costs predicted for next month
- Deliverables completed this month versus deliverables predicted
- Deliverables predicted for next month
Although the suggested format somewhat resembles the items calculated using the earned value method, this format deals explicitly with the impact of change requests and also uses function point metrics for expressing costs and quality data.
An interesting question is the frequency with which milestone progress should be reported. The most common reporting frequency is monthly, although exception reports can be filed at any time that it is suspected that something has occurred that can cause perturbations. For example, serious illness of key project personnel or resignation of key personnel might very well affect project milestone completions and this kind of situation cannot be anticipated.
It might be thought that monthly reports are too far apart for small projects that only last six months or less in total. For small projects weekly reports might be preferred. However, small projects usually do not get into serious trouble with cost and schedule overruns, whereas large projects almost always get in trouble with cost and schedule overruns. This article concentrates on the issues associated with large projects. In the litigation where the author has been an expert witness, every project under litigation except one was larger than 10,000 function points in size.
The simultaneous deployment of software sizing tools, estimating tools, planning tools, and methodology management tools can provide fairly unambiguous points in the development cycle that allow progress to be judged more or less effectively. For example, software sizing technology can now predict the sizes of both specifications and the volume of source code needed. Defect estimating tools can predict the numbers of bugs or errors that might be encountered and discovered. Although such milestones are not perfect, they are better than the former approaches.
Project management is responsible for establishing milestones, monitoring their completion, and reporting truthfully on whether the milestones were successfully completed or encountered problems. When serious problems are encountered, it is necessary to correct the problems before reporting that the milestone has been completed.
Failing or delayed projects usually lack of serious milestone tracking. Activities are often reported as finished while work was still on going. Milestones on failing projects are usually dates on a calendar rather than completion and review of actual deliverables.
Delivering documents or code segments that are incomplete, contain errors, and cannot support downstream development work is not the way milestones are used by industry leaders.
Another aspect of milestone tracking among industry leaders is what happens when problems are reported or delays occur. The reaction is strong and immediate: corrective actions are planned, task forces assigned, and correction begins to occur. Among laggards, on the other hand, problem reports may be ignored and very seldom do corrective actions occur.
In more than a dozen legal cases involving projects that failed or were never able to operate successfully, project tracking was inadequate in every case. Problems were either ignored or brushed aside, rather than being addressed and solved.
Because milestone tracking occurs throughout software development, it is the last line of defense against project failures and delays. Milestones should be established formally, and should be based on reviews, inspections, and tests of deliverables. Milestones should not be the dates that deliverables more or less were finished. Milestones should reflect the dates that finished deliverables were validated by means of inspections, testing, and quality assurance review.
An interesting form of project tracking has been developed by the Shoulders Corporation for keeping track of object-oriented projects. This method uses a 3-Dimensional model of software objects and classes using Styrofoam balls of various sizes that are connected by dowels to create a kind of mobile. The overall structure is kept in a visible location viewable by as many team members as possible. The mobile makes the status instantly visible to all viewers. Color coded ribbons indicate status of each component, with different colors indicated design complete, code complete, documentation complete, and testing complete (gold). There are also ribbons for possible problems or delays. This method provides almost instantaneous visibility of overall project status. The same method has been automated using a 3-D modeling package, but the physical structures are easier to see and have proven more useful on actual projects. The Shoulders Corporation method condenses a great deal of important information into a single visual representation that non-technical staff can readily understand.
Function Points and Tax Litigation
When companies are bought and sold, quite a bit of their value may be in the form of the software applications that they owned at the moment of the transaction. Thus the revenue services of many countries are interested in determining the value of software.
Often the software owned by companies was created some years ago, in the 1970’s or 1980’s and some of the original data has long been lost. The personnel who created the applications may have changed jobs or retired.
Thus determining the value of software for tax purposes is not an easy task. The most common approach is to try and replicate the development effort that might have been used. Doing this with a modern software cost estimating tool is not too difficult, but it is necessary to know a number of basic facts about the application and the personnel situation at the time of development, such as:
- The salary levels of the company during the time of development
- The overhead or burden rate used by the company
- The amount of unpaid overtime, if any, associated with the project
- The size of the application in function points
- The size of the application in source code statements
- The programming language(s) utilized
- The presence or absence of reusable materials
- The methods and processes used during development
Recreating typical patterns of software development is a frequent aspect of software tax cases. The opposing experts usually vary in their assertions of the experience of the development team, the volumes of reusable materials available, and the effectiveness of the tools and methods utilized. Since there are broad ranges in all of these factors, it is important to try and get as accurate a picture of what really occurred as possible.
In the United States, the usage of function point metrics for software tax cases is rapidly increasing. The older lines of code metrics have serious flaws for comparing applications done in different programming languages. They also have flaws for applications that were developed in more than one programming language, which occurs in about 30% of U.S. software.
The most serious problem with the LOC metric for software tax cases is the fact that this metric penalizes high-level languages and artificially inflates the productivity levels of low-level languages. Thus comparing the economics of an older project done in a low-level language such as assembly to a modern project done in a high-level language such as Smalltalk cannot be done using LOC metrics.
Independent Assessments of Software Contracts and Projects
Many consultants such as the author and his colleagues at Software Productivity Research are commissioned to perform independent assessments of software contracts to determine such things as the probability of:
- On-time or delayed delivery dates
- Probable quality
- Probable costs
Although independent assessments are effective in finding problems, they are often not commissioned until the project is already in some distress such as having missed a major milestone.
For large systems where the total costs will amount many millions of dollars, it would be simple prudence to engage independent assessment consultants at key stages for key activities rather than waiting until the project is in trouble. The key roles for independent software management consultants might be:
- Reviewing the terms of the contract for technical issues known to cause disputes.
- Determining or validating function point counts of the application at requirements.
- Determining or validating cost and schedule estimates.
- Determining or validating software quality methods.
- Suggesting methods of recovery for contracts that have veered off course.
- Ensuring the state-of-the art method have been utilized for the work at hand.
If independent assessments are planned for the project from the start, then both sides can anticipate the situation and prepare for it. Unfortunately, when a project is already in trouble independent software assessments are sometimes viewed as being analogous to the role of the “independent prosecutors” that are named for special investigations such as Watergate or White Water.
Of course, if both vendors and clients had empirical data available on software schedules, costs, quality, and other issues that might be troublesome in contracts, that would be an effective approach too.
Including Quality Requirements in Software Contracts
The second most common source of software contract dispute and litigation are assertions or poor quality or even worse, assertions that the software was delivered in inoperable condition.
We have also observed a major lawsuit where the client, who was the plaintiff, assumed that a major software application would be delivered with zero material defects after the completion of system test. Although zero defect software is a laudable goal, it has never occurred on applications larger than about 1000 function points in size. It does not occur very often for smaller applications either.
It almost always happens that the contract itself had no clauses or language dealing with quality and so the whole issue is based on what are implied industry norms for software quality levels. Here too, the function point metric is able to quantify results in such a way that contracts can include quality clauses.
Based on a studies published in three of the author’s books Applied Software Measurement (McGraw-Hill 2008) Software Quality – Analysis and Guidelines for Success (International Thomson Computer Press 1997); and Estimating Software Costs (McGraw Hill 2007) the average number of software errors is about five per function point. This data has been comparatively stable for the United States as a whole between the mid 1980’s and 2008.
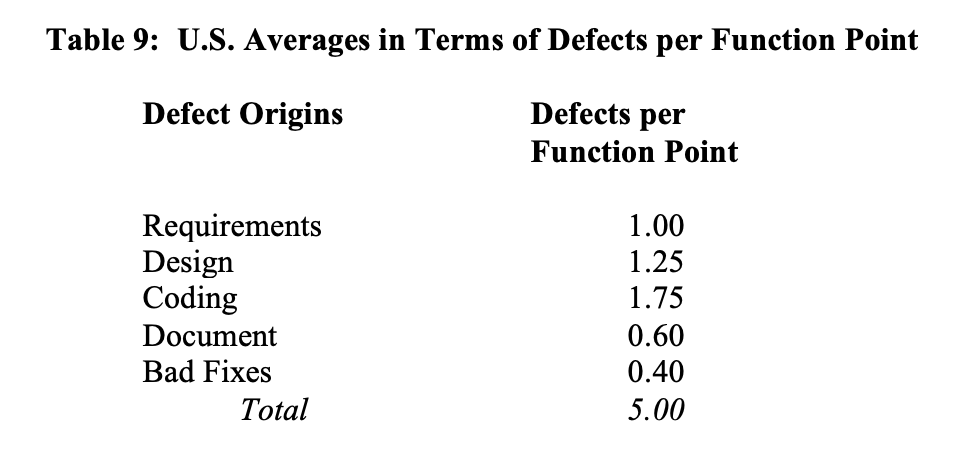
Incidentally, the range around this average value is about 2 to 1 in both directions; i.e. values from below 2.5 defects per function point to almost 10 defects per function point have been noted.
These numbers represent the total numbers of defects that are found and measured from early software requirements throughout the remainder of the life cycle of the software. The defects are discovered via requirement reviews, design reviews, code inspections, all forms of testing, and user-reported problem reports.
Several commercial software estimating tools such as CheckpointÒ and KnowledgePlanÒ and Software Risk Master™ include features for estimating software defects, severity levels, and defect removal efficiency. Some outsource vendors also have internal proprietary tools with similar quality estimating features. Whether a commercial or proprietary tool is utilized, it is a “best practice” to perform a formal quality estimate as part of outsource agreements. The pragmatic reason for this is because the effort and costs of removing defects often take more effort than anything else in large software projects. Unless defect potentials and defect removal methods are anticipated, it is difficult to estimate overall project schedules and costs.
For software contracts, there is a very powerful software quality metric that has had an interesting history and a very interesting pattern of deployment throughout the industry. The metric is called “defect removal efficiency” and it is an easy metric to calculate. During the development cycle of a software project, the development team or the quality assurance group keeps a record of all bugs or defects that are found. For example, assume that during development of a program the developers find 90 bugs.
When the program is released to customers, continue to keep records of bugs or defects that are found during the first year of usage. Continuing with the same example, assume that the users found 10 bugs during the first year. After a suitable time interval (such as three months or 90 days of usage) aggregate the pre-release defect reports and the post-release defects found by clients and calculate the efficiency with which bugs were eliminated.
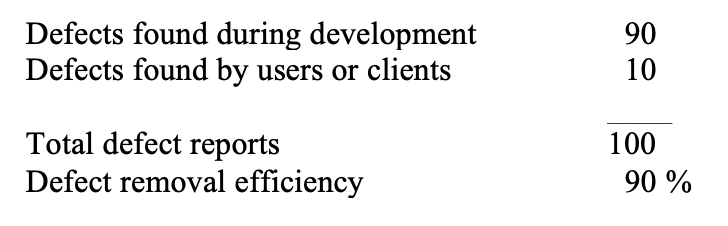
As of 2015, the approximate U.S. norm for defect removal efficiency is about 90%. However, best in class organizations can average more than 95% and achieve more than 99% for their very best results on a few projects. Unfortunately, perfect defect removal efficiency or 100% appears to be beyond the current state of the art. From analyzing about 9500 software projects, zero defects in the first year of usage has only been observed in two small projects. Both of these zero-defect projects were less than 300 function points in size, had stable requirements with no changes, and had development teams who had built at least half a dozen similar applications.
It would be appropriate to include a specific target for defect removal efficiency in software contracts. The author suggests a value such as 96% removal efficiency to be determined three months after the first full deployment of the application. There might be some form of penalty clause in the outsource agreement if defect removal efficiency levels are below 90%. Of course the post-release defect counts must be validated by an independent source to ensure that outsource vendors are fairly treated.
Achieving High Quality and Excellence in Defect Removal Efficiency
In order to achieve high levels of defect removal efficiency, it is necessary to use state of the art quality control approaches. For large software applications, formal design and code inspections plus formal testing are the only known ways of exceeding 95% in cumulative defect removal efficiency levels.
As it happens, achieving excellence in defect removal efficiency will optimize the probability that the project will finish on time and within budget. Many software projects fail or can’t be delivered because quality is low, so formal pre-test inspections can shorten schedules, lower costs, and improve user satisfaction simultaneously.
Table 10 shows the approximate ranges of defect removal efficiency levels for selected kinds of defect removal activities:
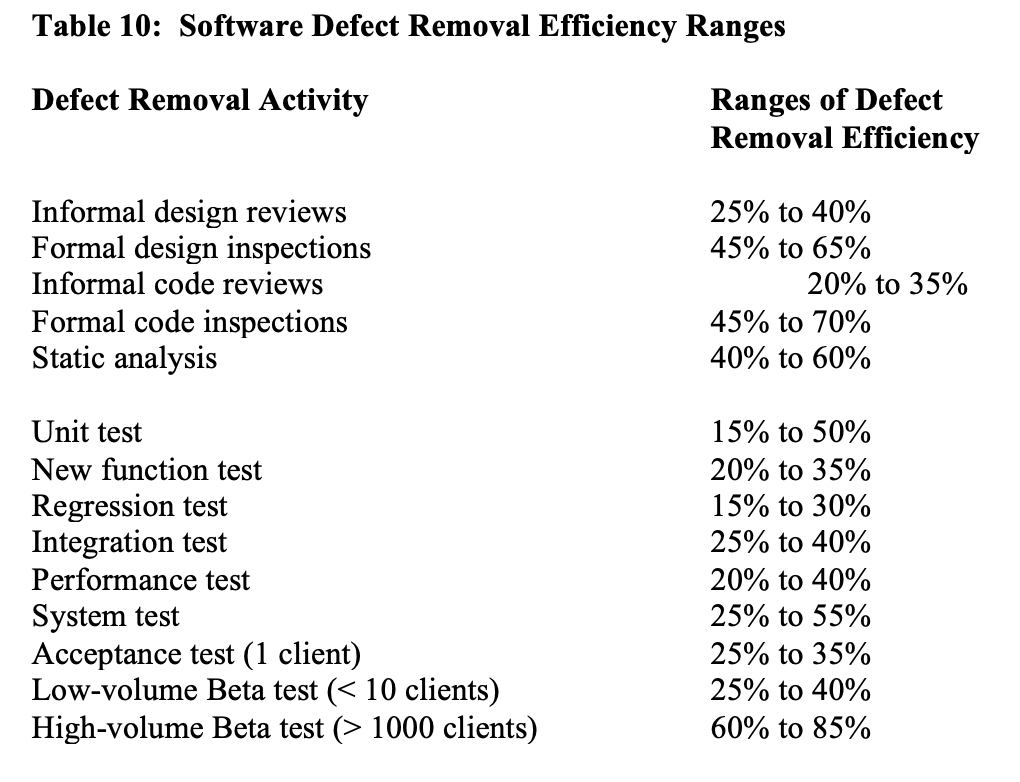
It is obvious that no single defect removal operation is adequate by itself. This explains why “best in class” quality results can only be achieved from synergistic combinations of defect prevention, reviews or inspections, and various kinds of test activities. Between eight and 10 defect removal stages are normally required to achieve removal efficiency levels > 95%.
Other interesting clauses can be inserted into software contracts and outsource agreements to deal with the quality of the delivered materials and also with defect removal efficiency levels.
For example, a contract might deal with software quality in any or all of the following ways:
- By specifying permissible levels of defects during the first year of usage, such as no more than 0.05 defects per function point of severity 1 and severity 2 categories in the first year of production as measured by an independent QA organization.
- By demanding that the vendor achieve a specified defect removal efficiency level, such as 96.0%, and keep the records to prove it. (Such records would be counts of all development bugs and counts of all user-reported bugs for a predetermined time period such as delivery plus 90 days.)
- By demanding that the vendor utilize certain quality control methods such as formal inspections, testing by trained specialists, an active quality assurance group, and a quality measurement and defect tracking tools.
- By demanding that the vendor achieve certain levels of assumed quality control, such as insisting on ISO 9001 certification or SEI CMM level 3 attainment. However, neither ISO certification nor achieving a specific SEI CMM level guarantees high quality. Achieving SEI CMM level 3 does raise the odds of high quality. However, ISO certification has not yet demonstrated any significant software quality improvements, although there are assertions that hardware quality benefits.
- By requiring, as do some military software contracts, that the quality levels be assessed by independent consultants or subcontractors who are not under direct control of the prime contractor. This is termed “independent verification and validation” (IV&V) and has been a standard part of military software contracts for many years although rare in a civilian context.
Whatever the final language in the contract, software quality estimation, measurement, and control are now good enough so that outsource and software development contracts can easily include quality language that will be acceptable to both sides and also have a good chance of delivering high quality in real life.
Baselines and Productivity and Quality Improvement Agreements
It frequently happens that outsource contracts include language that requires the vendor to demonstrate annual improvements in software quality, productivity, and schedules against an initial baseline.
There are several hazards with achieving these contractual improvements. The major problem, however, is the difficulty of creating a valid and accurate initial baseline. To be blunt, if the client had been capable enough to create accurate quality and productivity baselines they might also have been so good at building software that the outsource agreement might not have occurred.
Many outsource agreements are initiated because the software capabilities of the client are not very sophisticated. This means, inevitably, that the client lacks accurate quality and productivity data.
The most common problem with productivity baselines is that they omit between 35% and 75% of the actual work performed on software projects. These incomplete baselines make the client’s productivity seem much higher than it really is, and hence cause the outsource vendor to have an artificially high starting point.
Table 11 was published in Applied Software Measurement (McGraw Hill 2008) and shows the typical gaps and omissions in software cost and resource data:
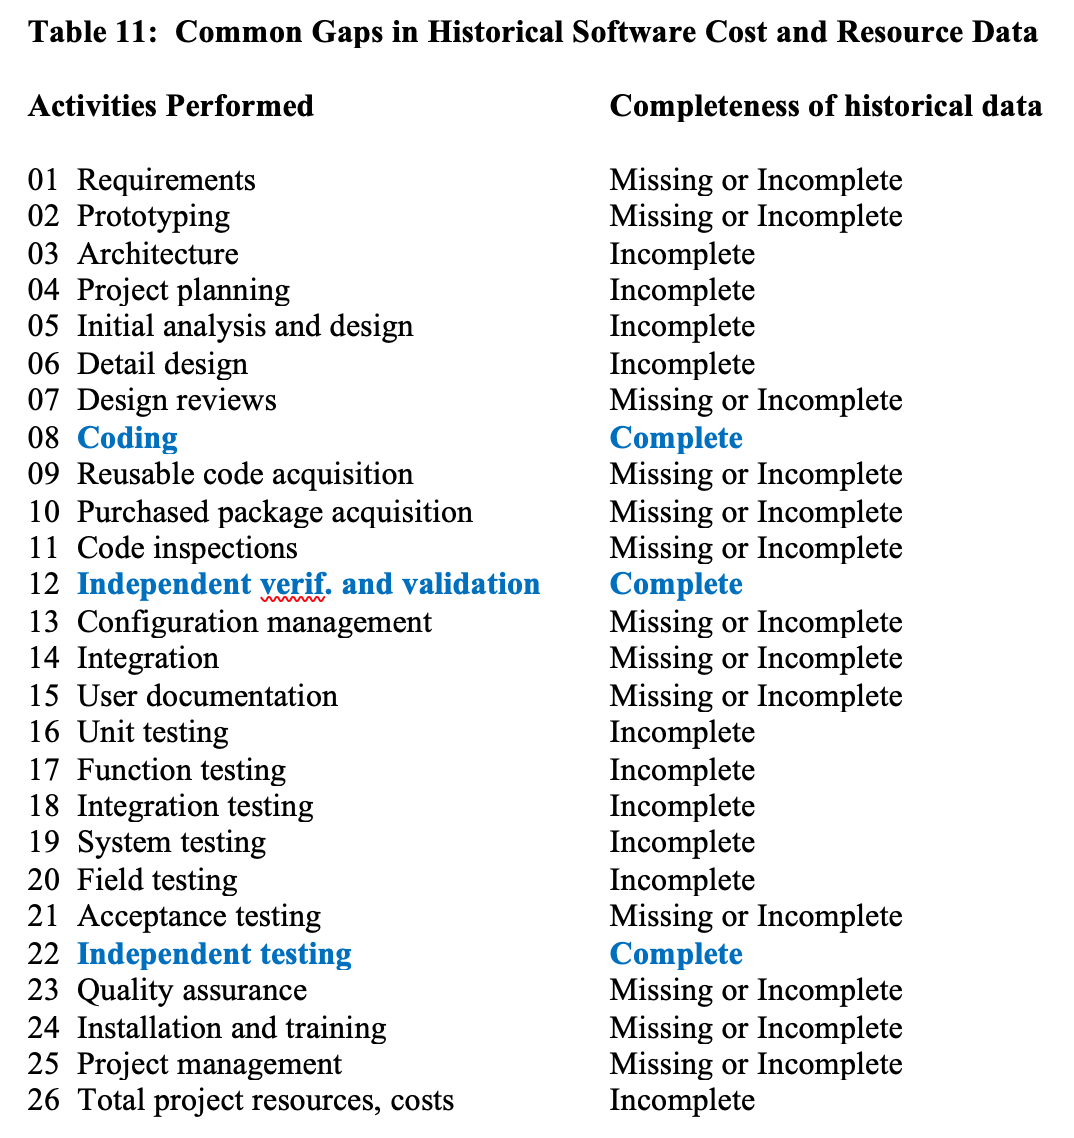
Only about three activities out of a possible 25 are routinely accurate enough so that the data is usable for baseline purposes. The effect of the missing or incomplete data is to drive up apparent productivity rates, and make projects seem cheaper and more productive than they really were.
For example, if the client’s data is as incomplete as that illustrated by table 10 then their actual productivity would be in the range of about 5.0 function points per staff month of less on a typical 1000 function point development project. But due to the gaps and missing data, the client might present the vendor with a baseline that indicates a productivity rate of 20.0 function points per staff month on such projects. This inflated rate is because the client’s cost and resource tracking system omits about 75% of the actual effort.
Often the client’s original baseline data only contains information on low-level design, coding, and testing. But the terms of the contract require that the outsource vendor show an improvement for the entire development cycle: i.e. requirements, analysis, design, coding, testing, user documentation, and project management. Surprisingly, many client executives do not even know what their baseline data contains. They assume their data is complete, when in fact it only represents 35% or less of a full project life cycle.
One solution to the problem of exaggerated and incorrect baselines would be to include a data validation clause in the contract. That is, an independent third party would be asked to interview client personnel and assess the validity of baseline data. If, as normally occurs, the baseline resource and cost data is wrong and incomplete, then the third party could construct a more realistic baseline based on filling in the missing elements. This of course would add time and expense to the contract. Also, since many client executives are not aware of the errors of their baseline data, it would not be easy to convince client executives of the need to create a baseline independently.
Quality baselines are even harder to gather than productivity baselines. In the United States, less than 10% of software organizations have any substantial amounts of quality data. The companies that have really good and accurate quality data are often so sophisticated that they may not resort to outsource agreements.
Almost none of the client organizations that enter into outsource agreements have enough quality data to create a valid baseline. Therefore it is fatuous to include quality improvement targets in contracts if the starting baseline points are essentially unknown.
A possible solution to the quality baseline problem is not even to bother trying to collect the client’s data before the outsource agreement starts. The contract might include a clause that the vendor will commit to achieving more than 96% defect removal efficiency (or some other agreed-to level). The efficiency level would be calculated after an agreed to period of usage, such as 90 days after deployment. Thus if 94 bugs are found by the outsource vendor before delivery, and the client finds 4 defects in the first 90 days, then the contractual obligation to achieve 96 defect removal efficiency has been met.
If the outsource vendor only finds 80 defects and the client finds 20 defects in the first 90 days, then the removal efficiency is only 80% and some kind of penalty or corrective action would be triggered.
If such clauses are used, it would probably be necessary to include severity levels also. For example a contract might call for zero severity 1 defects, and very low numbers of severity 2 defects (using IBM’s 4-level severity scale where severity 1 implies total failure and severity 2 implies serious problems). Severity 3 and 4 defects might be excluded from the agreement, or permitted in reasonable quantities.
Here too, independent collection of the defect data by a third party may be necessary to ensure that neither side is manipulating the data called for by the contract. However, organizations that have a software quality assurance group that reports to a separate management chain would probably trust this group to be accurate and independent enough so the data could be used contractually.
The fundamental problem with outsource contracts that require improvements against a starting baseline is the difficulty of ascertaining what the baseline truly is. Corporate software cost tracking systems are notoriously incomplete and inaccurate so this data is a poor choice.
The most accurate solution would be to have the baseline constructed by an independent third party. If the outsource agreement is to last more than 5 years or has a value of more than $50,000,000 then it is worth the added cost and effort to establish a valid initial baseline. Even with an independent baseline, however, if either the client or the outsource vendor feels that the baseline constructed by the third party is flawed or inaccurate, there must also be some method of appealing the results.
Yet another method of overcoming the lack of accurate baseline data for specific companies would be to exclude the client’s local data altogether. The outsource vendor would be required to demonstrate improvements against published industry average data points. Some of the published sources that might be used for establishing industry norms would be the annual benchmark data points published by organizations such as the Compass Group, the International Function Point Users Group (IFPUG), Howard Rubin Associates, or Software Productivity Research. Since 1997 the data published by the International Software Benchmark Standards Group (ISBSG) has become a major source of baselines and benchmark data. ISBSG has about 5000 projects as of 2008, and is adding new data at a rate of perhaps 500 projects per year.
Incidentally, another aspect of the problem of making improvements against a starting baseline is the rate at which improvements can be made. While clients would like to see annual improvements of 30% or more, these seldom occur in real life. Software quality levels can sometimes improve more than 30% per year for several years in a row. However, software productivity levels seldom improve at an annualized rate of more than about 12%. The first year after an outsource agreement is begun, there are usually no improvements at all because of the start-up problems of transferring work from the client to the outsource vendor.
Therefore realistic contracts that call for improvements against starting baselines would not call for any tangible improvements until the end of the second year. The peak period in terms of rate of improvement would be during years 3 through 5 of the outsource agreement. If the annualized rate of quality and productivity improvement called for by the contract is higher than about 12% for a 5-year agreement, there is a fairly low probability of success.
SUMMARY AND CONCLUSIONS
As outsourcing and contracting grow in frequency and in dollar value, there is an urgent need for software contracting groups, the legal profession, and management consultants to develop contractual instruments that will be less ambiguous than has been the norm to date.
The root causes of disputes and litigation for breach of contract have centered around missed delivery dates, cost overruns, creeping user requirements, and poor quality levels. All of these root causes are now amenable to alleviation and even to complete elimination.
The usage of function point metrics for software contracts can minimize or eliminate many of the problems associated with traditional software contracting practices. In addition, the utilization of independent assessments and the utilization of explicit quality criteria can minimize other common sources of friction.
Outsource agreements are often ambiguous in terms of software issues relating to baselines, productivity, and quality levels. There has also been ambiguity in other key issues such as responsibility for year 2000 repairs. As software outsource contracts increase in numbers, there is a need to minimize the ambiguities in the contracts that might lead to conflict and litigation.
SUGGESTED READINGS ON SOFTWARE TOPICS
Boehm, Barry Dr.; Software Engineering Economics; Prentice Hall, Englewood Cliffs, NJ; 1981; 900 pages.
Brooks, Fred; The Mythical Man Month; Addison-Wesley, Reading, MA; 1995; 295 pages.
Brown, Norm (Editor); The Program Manager’s Guide to Software Acquisition Best Practices; Version 1.0; July 1995; U.S. Department of Defense, Washington, DC; 142 pages.
DeMarco, Tom; Controlling Software Projects; Yourdon Press, New York; 1982; ISBN 0-917072-32-4; 284 pages.
Department of the Air Force; Guidelines for Successful Acquisition and Management of Software Intensive Systems; Volumes 1 and 2; Software Technology Support Center, Hill Air Force Base, UT; 1994.
Dreger, Brian; Function Point Analysis; Prentice Hall, Englewood Cliffs, NJ; 1989; 225 pages.
Garmus, David & Herron, David; Measuring the Software Process: A Practical Guide to Functional Measurement; Prentice Hall, Englewood Cliffs, NJ; 1995.
Garmus, David & Herron, David; Function Point Analysis; Addison Wesley Longman, Boston, MA; 2001; ISBN 0-201-69944-3; 363 pages.
Grady, Robert B.; Practical Software Metrics for Project Management and Process Improvement; Prentice Hall, Englewood Cliffs, NJ; ISBN 0-13-720384-5; 1992; 270 pages.
Grady, Robert B. & Caswell, Deborah L.; Software Metrics: Establishing a Company-Wide Program; Prentice Hall, Englewood Cliffs, NJ; ISBN 0-13-821844-7; 1987; 288 pages.
Howard, Phil; Guide to Software Productivity Aids; Applied Computer Research, Scottsdale, AZ; ISSN 0740-8374; published quarterly.
Humphrey, Watts; Managing the Software Process, Addison-Wesley, Reading, MA; 1990.
Humphrey, Watts; A Discipline of Software Engineering; Addison-Wesley, Reading, MA; 1995; 785 pages.
Humphrey, Watts; Managing Technical People; Addison-Wesley, Reading, MA; ISBN 0-201—54597-7, 1997; 326 pages.
IFPUG Counting Practices Manual, Release 4.1, International Function Point Users Group, Westerville, OH; April 1999.
Johnson, James et al; The Chaos Report; The Standish Group, West Yarmouth, MA; 2000.
Jones, Capers; Software Patterns and Anti-Patterns; CRC Press; 2022p 275 pages.
Jones, Capers; The Technical and Social History of Software Engineering, Addison Wesley 2015 (contains summaries of important software industry lawsuits such as anti-trust and patent violations).
Jones, Capers: “Studio 38 in Rhode Island – A Study of Software Risks”; 2012, published in various Rhode Island newspapers such as the Providence Journal, South County Independent, Narragansett Times, etc.
Jones, Capers and Bonsignour, Olivier; The Economics of Software Quality; Addison Wesley, Boston,
MA; ISBN 10 0-13-258220-1; 2011; 587 pages.
Jones; Capers; Software Engineering Best Practices; McGraw Hill, New York, NY; ISBN 978-0-07-162161-8; 2010; 660 pages.
Jones, Capers; Applied Software Measurement; McGraw Hill, 3rd edition 2008; ISBN 978-0-07-150244-3; 659 pages.
Jones, Capers; Assessment and Control of Software Risks; Prentice Hall, 1994; ISBN 0-13-741406-4; 711 pages.
Jones, Capers; Patterns of Software System Failure and Success; International Thomson Computer Press, Boston, MA; December 1995; 250 pages; ISBN 1-850-32804-8; 292 pages.
Jones, Capers; Software Quality – Analysis and Guidelines for Success; International Thomson Computer Press, Boston, MA; ISBN 1-85032-876-6; 1997; 492 pages.
Jones, Capers; Estimating Software Costs; 2nd edition; McGraw Hill, New York, NY; 2007.
Jones, Capers; “Sizing Up Software;” Scientific American Magazine; December 1998; Vol. 279, No. 6; pp 74-79.
Jones, Capers; Software Assessments, Benchmarks, and Best Practices; Addison Wesley Longman, Boston, MA; May 2000; ISBN 0-201-48542-7; 700 pages.
Kan, Stephen H.; Metrics and Models in Software Quality Engineering; 2nd edition; Addison Wesley, Reading, MA; ISBN 0-201-72915-6; 2003; 528 pages.
Marciniak, John J. (Editor); Encyclopedia of Software Engineering; John Wiley & Sons, New York; 1994; ISBN 0-471-54002; in two volumes.
Multiple authors; Rethinking the Software Process; (CD-ROM); Miller Freeman, Lawrence, KS; 1996. (This is a new CD ROM book collection jointly produced by the book publisher, Prentice Hall, and the journal publisher, Miller Freeman. This CD ROM disk contains the full text and illustrations of five Prentice Hall books: Assessment and Control of Software Risks by Capers Jones; Controlling Software Projects by Tom DeMarco; Function Point Analysis by Brian Dreger; Measures for Excellence by Larry Putnam and Ware Myers; and Object-Oriented Software Metrics by Mark Lorenz and Jeff Kidd.)
Paulk, Mark, Curtis, Bill, et al; The Capability Maturity Model; Addison Wesley, Reading, MA; ISBN 0-201 54664-7; 1995; 441 pages.
Putnam, Lawrence H.; Measures for Excellence — Reliable Software On Time, Within Budget; Yourdon Press – Prentice Hall, Englewood Cliffs, NJ; ISBN 0-13-567694-0; 1992; 336 pages.
Rubin, Howard; Software Benchmark Studies For 1998; Howard Rubin Associates, Pound Ridge, NY; 1998.
Symons, Charles R.; Software Sizing and Estimating – Mk II FPA (Function Point Analysis); John Wiley & Sons, Chichester; ISBN 0 471-92985-9; 1991; 200 pages.
Wiegers, Karl E.; Creating a Software Engineering Culture; Dorset House, New York, NY; ISBN 0-932633-33-1; 1996; 424 pages.
Yourdon, Ed; Death March – The Complete Software Developer’s Guide to Surviving “Mission Impossible” Projects; Prentice Hall PTR, Upper Saddle River, NJ; 1997; ISBN 0-13-748310-4; 1997; 218 pages.
BIO:
Capers Jones, Vice President and CTO, Namcook Analytics LLC
Email: Capers.Jones3@Gmail.com
Web: www.Namcook.com