 One of my clients recently was asked for advice on the company’s plans to introduce a new variable compensation system for employees incorporating safety performance.
The company’s previous bonus system was only connected to their lost time injuries (LTI) performance, which presents two potential drawbacks for organizations that have not yet reached full safety performance maturity.
First, when a bonus system is entirely based on LTI, or other lagging indicators, it can discourage reporting or make people come to work when they should stay at home. The second problem with basing rewards on LTls is that it often does not result in any action, simply because people fail to see how it translates into their daily routines.
My client company realized it needed to use a balanced mix of leading and lagging indicators, the new system which I reviewed included a combination of both. The main lagging indicator for the company was still LTI, and a near zero LTls was the condition for employees to be eligible for their payment.
First let’s clarify the definitions of lagging and leading indicators, Lagging Indicator is more commonly known as a measurement tool for a company’s incidents in the form of a past accident or statistic (i.e., focusing on recordable injuries, injury frequency or lost workdays, Leading Indicator is described as a measure indicating the risk of a future event. Leading indicators are used to drive or measure activities that will aid in preventing or controlling an incident/injury before it occurs.
To understand the differences between leading and lagging indicators, let’s consider the following soccer analogy, let’s assume your favorite soccer team won the FA cup last year. This year, you and your friends have decided to engage in a friendly bet for the upcoming season.
If you had $500 to bet on or against Blackpool
(Your favorite team), what data would you use.
To make your bet? Would you just rely on last year’s statistics? Or would you want to know who the returning players are? Who has been drafted or traded away this season? What was the injury status of all of the team members?
Most of us would base our decision on how the team is expected to perform based on an analysis of the data mentioned above instead of relying on past results, like last year’s FA cup win (and we all know that Arsenal has won 3 out of 4 consecutive FA cup wins in the past few years), Blackpool only once.
IThe same is true for safety. Last year’s safety records are not predictive data for next year’s safety performance, to be proactive with safety, we need current data (leading indicators) that tell us which parts of our safety management system are performing poorly so we can correct issues before they result in injuries or damage accidents.
Lagging indicators like your incident / accident rate are measured only after an injury has occurred, that is like driving your car by looking through the rear-view mirror, it tells you where you have been, but not where you are going.
MAKING THE MOST OF KPI’s THROUGH AN INTEGRATED PERFORMANCE MANAGEMENT SYSTEM:
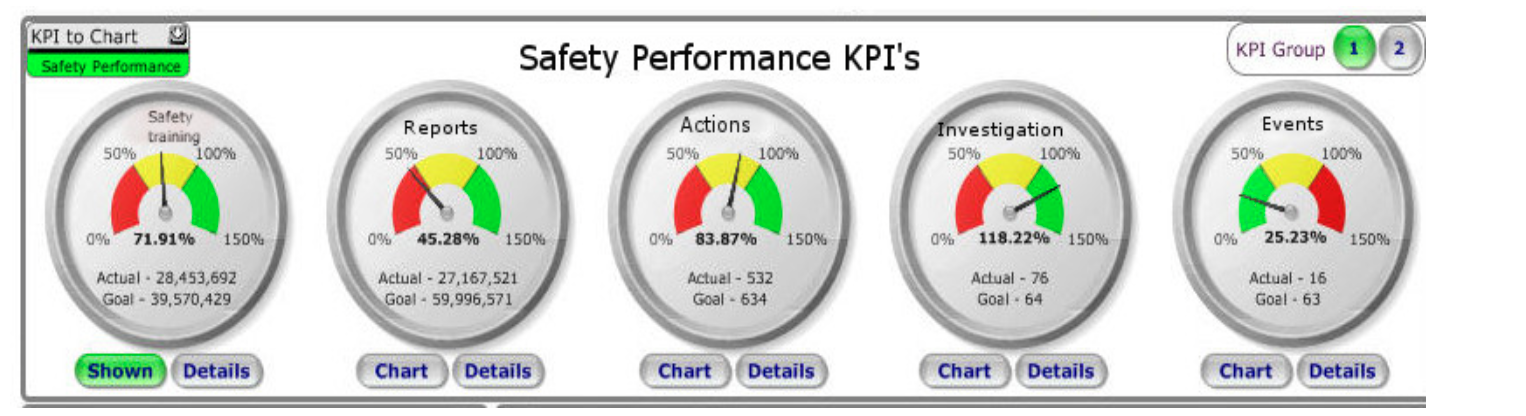
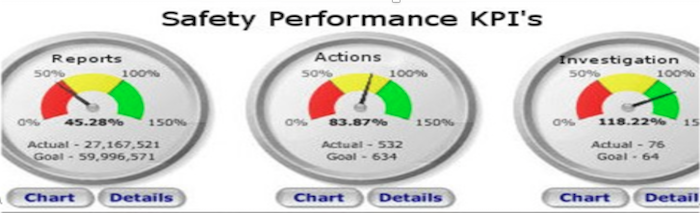
These key performance indicators (KPls) look good at first sight, but let’s examine performance management and what it is meant to achieve. The old saying, “What interests my boss, fascinates me,” is, of course, still valid. But a strong performance management system consists of much more than simply producing a long list of KPls.
The fundamental elements of performance management are:
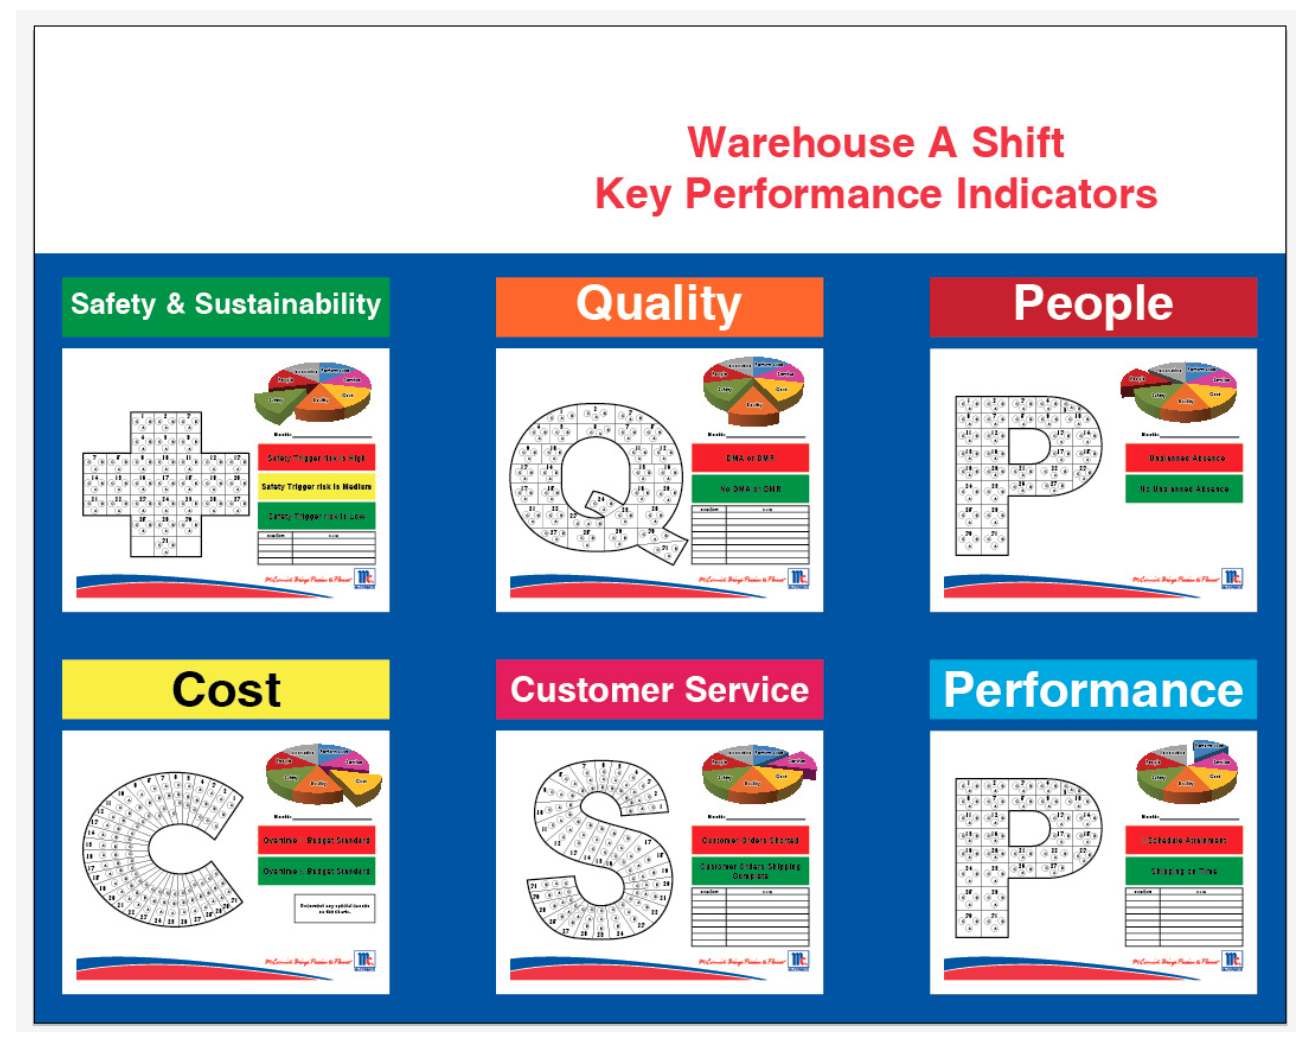
- Strategy/KPls/visual management
- Regular performance dialogues
- Structured problem solving
- It is essential to take a step back and rethink your actual strategy. In what specific areas do you really need to excel, and in which can you accept parity? A clear, prioritized strategy enables an organization to push decisions to the lowest possible level, enabling people at that level to understand the ultimate priorities. Once a clear strategy is established, it needs to be translated into meaningful KPls for every level of the organization.
A high-level KPI, such as LTI, will not do the trick. Organizations need to think about how it can be captured into one or more meaningful KPls that are tangible on the shop floor. Seen from that angle, the new list of leading indicators proposed by the oil & gas company already is much more meaningful than their previous focus on LTls. Visual display and visual management of meaningful and real-time KPls for each department enables regular performance dialogues and helps promote a daily cross-functional review between operations, maintenance, and engineering. It also can help identify topics that need to be escalated to the weekly or monthly long-term management process.
The third leg of strong performance management is problem solving at different levels. Long lists of action items, or a long backlog in maintenance departments, are all too common because often, every deviation is referred to another department, buried in a work order or placed on a project list. Highly effective problem-solving uses the capabilities of the entire organization, including the lowest level possible. This may require a change in company culture toward a more independent or interdependent organization, so that operators, mechanics, lab technicians and customer service representatives not only feel permitted, but encouraged, to solve the majority of problems themselves, right away.
Many operators know their process and equipment so well that they can quickly identify when something deviates from the norm – companies should not ignore this familiarity but put it to use.
Of course, there will always be issues that need the involvement and expertise of different departments, but that should not be the automatic first response. This should be reserved for second-tier problem-solving that brings together the right people to solve an issue in the short term. And some more fundamental problems may need to be solved in longer-term projects, Kaizens, or value accelerators, led by a project leader.
QUESTIONS TO ASK YOURSELF WHEN SETTING KPIS
Let us go back to the initial question from this oil & gas company: Can you advise on the leading KPls for a bonus system? Before analyzing their five specific leading indicators, it is worth asking a few critical questions in order to find out what the organization can realistically expect to achieve:
- How would you describe the safety maturity of your organization?
- Where are you now in terms of safety culture, and where do you want to go?
- What behavior are you trying to drive with this variable compensation system?
The answers to these questions matter. If an organization is not yet “mature” in its safety performance, it will need to focus on preventing fatalities and serious injury accidents, as well as high potential near misses, before introducing a KPI for other more minor near misses. With increasing maturity, the organization can select additional KPls, as well as react to more subtle signals.
In an immature organization that is just starting with an auditing system, it probably makes sense to track quantity metrics like the execution of the number of audits. As the organization develops in maturity, quality metrics should be introduced, e.g., audit scores and actions completed on time. Once this is under control, companies can add a focus on repetitive findings, and make a connection between audit findings and actual incidents
KEEPING KPIS FRESH
At another client, DuPont, the traditional KPls that they have been driving – but not necessarily rewarding financially – on top of their lagging performance indicators include:
- Audit execution and results with evaluation of findings,
- Execution of inspections (specifically on process safety critical processes)
- Execution of safety action plans (including upgrading procedures, systems, investments, etc.)
- Safety observations execution (and, if possible, quality of observations and closure of actions)
- Participation in safety training and safety meetings
- Execution of safety training plans (legally required and other)
- Permit to work deviations.
Safety perception survey results and follow-up on action items, several clients use the last KPI, safety perception surveys, as a tool to probe and uncover safety culture performance issues that might otherwise go unnoticed and that could adversely affect their safety performance. They offer a proven and effective solution to pinpoint the “safety conscience” within the organization and allow them to address issues proactively before an incident occurs.
DuPont also has focused on improving idea-generation, or “bottom-up innovation,” by tapping into the problem-solving capabilities of the entire organization. They are therefore measuring the generation of ideas and their actual implementation. The aim, as mentioned before, is to move resolution of action items to the lowest possible level and avoid a long list of capital projects or maintenance work orders.
Another leading indicator that some of DuPont’s sites recently introduced is a safety culture pulse check. This consists of a targeted, short list of questions asking people how they feel about EHS, how leaders are behaving and how supervisors are responding to feedback from teams. This is in addition to their more extensive safety perception survey, which takes place every other year. The pulse check was added to keep safety perception alive and occurring at regular intervals. Emphasis is placed on promoting dialogue rather than the recorded results.
The aim is to keep KPls fresh and effective. Instead of just continuing to use the same KPls as before, it is important to monitor performance against them. If all action items are closed, if your dashboard shows green all the time, that is the time to be suspicious, not the time to relax and be complacent. It is precisely the moment to ask yourself what is going on and whether you should be re-evaluating your KPls and digging deeper.
As mentioned before, the right KPls can drive the right behavior (if you include the other critical elements of a performance management system), but consequently the wrong KPls can drive the wrong behavior.
In principle, EHS compliance and proactive behavior are a condition of employment. So it can be very tricky to reward people for behavior that is expected of them in the first place. With all this in mind, here is my response on the leading indicators that the oil & gas company was considering:
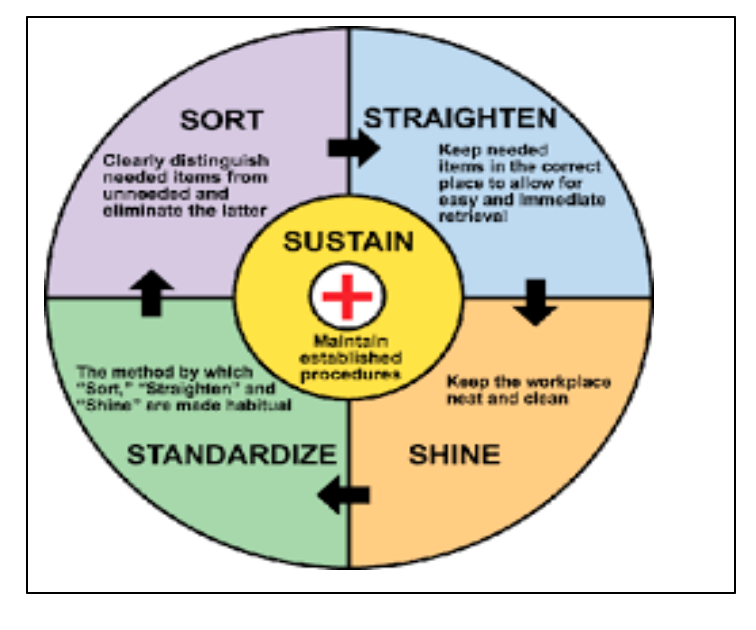
- 5S: It is good to make a connection between 5S and safety, and “Sustain” in 5S indicates that it’s critical to pursue this at all times. But adding it as a leading indicator connected to the bonus system might limit the process of cascading resolution of action items to lower levels of the company. Ideally, employees would be empowered to own a 5S and do the checklists themselves. Incentivizing an audit of their own area with a variable compensation system might lead to a biased review.
Implementation of safety action plans: Strong follow-up and disciplined closing of action items is a clear indicator of the operational discipline and the workload in an organization. However, since most organizations do not use their first-tier problem-solving capabilities very often, not many action items are assigned to the shop floor. Action items will mainly be allocated to engineers, supervisors, managers, and professionals. And in that case, shop-floor employees might not be able to influence the implementation or closure of action items.
- Organization of safety briefings: This clearly should be part of the job. Both organizing and attending safety briefings, training and toolbox meetings should be mandatory and therefore should not be rewarded monetarily.
- Reporting of near misses: This is another important indicator of the cultural maturity of an organization. Mature companies want to ensure they actively are addressing near misses before actual injuries occur. They want people to be more proactive. Sometimes when I visit a plant, I see damaged warehouse racks and protection bars, and yet there are no reports of any internal traffic incidents. Something clearly isn’t adding up. Reporting of near misses is important. At the same time, it is important to have a good reflection of reality when it comes to reporting near misses without driving an excessive amount of reporting. Therefore, “quality” near misses should be reported, or only those incidents that offer critical opportunities to learn.
Another approach is to track and reward the number of safety improvement ideas generated and implemented. This could drive the same behavior with a better KPI that tracks the level of learning in your organization.
- Safety audits: Auditing your safety management system is critical.But where do you set the target? Do you focus on the audit score or on the execution of the audit plan? Execution of the audit plan is a straightforward KPI that people should be able to influence.
Putting a target on the auditing scores, however, includes some potential risks. This type of KPI might put pressure on the auditors in a less mature organization. They will know that the organization’s variable compensation system will depend on how strict they are (and an audit is never fully black and white). Sometimes, people have an increased understanding of what a standard really means, and they raise the bar for themselves. Sometimes, the audit score stays flat because they are looking at it with different eyes, which is what you want to encourage to constantly raise the bar.
A strong performance management system consists of several elements that need to be integrated to achieve the desired results. KPls are just one of them. Companies can use KPls to influence people’s behavior and, in the end, organizational performance, but it is essential to carefully consider what behavior you want to drive versus what it is that your existing KPls will actually accomplish. What could be the unintended consequences?
Although a variable compensation system directly linked to EHS KPls can work, companies also should consider the power of reward and recognition, beyond monetary rewards. Maintaining a strong safety culture requires collaboration among the entire organization. Other recognition initiatives could consist of team awards/team events when reaching certain milestones, verbal recognition for extraordinary achievements (president’s safety award, safety coins, safety medals) or team rewards for improvement ideas generation.
As a company’s work to build a continuously improving health and safety program, experts place a growing level of importance on measuring safety performance using a variety of techniques, tools and key performance indicators (KPls). Despite the proof found in studies that failure-focused measures don’t help company’s drive continuous improvement1, a large number of Environment, Health, and Safety (EHS) initiatives are still assessed using lagging KPls.
Using leading indicators, on the other hand, enables executives to build a safety program that identifies risks and takes the necessary corrective actions in an effort to prevent injuries and incidents before they happen.
The Definitive Guide to Leading Indicators acts as a roadmap to explain what leading indicators are, how using them effectively will drive safety performance and lastly, how you can measure successful outcomes Although you may have previously read a variety of methods for using leading indicators, it’s important to know that there isn’t one concrete method that will guarantee a change in your safety performance overnight. Rather, “best practices” can be achieved to ensure a path of progression and continuous improvement in safety.
Let’s first clear up the definitions of lagging and leading indicators.
Lagging Indicator is more commonly known as a measurement tool for a company’s incidents in the form of a past accident or statistic (i.e., focusing on recordable injuries, injury frequency or lost workdays.
Leading Indicator is described as a measure indicating the risk of a future event. Leading indicators are used to drive or measure activities that will aid in preventing or controlling an incident/injury before it occurs.
The same is true for safety. Last year’s safety records are not predictive data for next year’s safety performance, to be proactive with safety, we need current data (leading indicators) that tell us which parts of our safety program are performing poorly so we can correct issues before they result in injuries. Lagging indicators like your incident rate are measured only after an injury has occurred, it is like driving your car by looking through the rear-view mirror, it tells you where you have been, but not where you are going.
Caterpillar, another client company renowned globally demonstrated this ideology in a recent training course I conducted. They were able to reduce lost time injuries and illnesses by 85% over a 10 year period due to the company’s transition to a culture that utilizes leading indicators for safety.
There isn’t a “secret sauce” for implementing leading indicators; however, if companies are able to utilize the correct forms of measuring, tracking, and understanding the information, over time, they’d be able to see a significant improvement in safety performance.
THE DEFINITIVE GUIDE TO LEADING INDICATORS WILL OUTLINE THE FOLLOWING AREAS:
Leading indicators serve as a tool to identify the current risks facing your company. They can help provide deep insights into the strengths and weaknesses of your EHS program, as well as display the need for additional measures. In this section, we are going to cover the need to adopt leading indicators by looking at the opportunities and limitations of both leading and lagging indicators.
To be able to better understand the benefits of leading indicators, it is important to first recognize the limitations of lagging indicators – a measure that is more widely used in companies. Lagging indicators alone may not be sufficient to improve EHS outcomes for the following reasons:
1 Lagging indicator often lacks predictive power.
Waiting for incidents to occur before implementing safety measures may send the wrong message to the workforce about the company’s safety culture. To put this in perspective, it’s like telling employees that the company will wait for worker #1 to get injured before taking measures to prevent the same fate for worker #2. If leaders want to drive both productivity and achieve a strong safety culture, then it is crucial to focus primarily on leading indicators.
2 Measuring safety performance through lagging indicators can be expensive.
A Liberty Mutual study estimates that for every $1 of direct accident costs, there are $3 of indirect costs. Some studies indicate that hidden costs can be 4 to 10 times the insured costs. Therefore, in total, OSHA estimates that the direct cost of a recordable incident is $7,000 and a workplace fatality is $910,000.
Waiting for an incident to occur before taking action is far more expensive than investing in programs that reduce incidents before they happen.
3 Lagging indicators can fail to support continuous learning opportunities.
By definition, companies that experience few incidents have very little lagging data to analyze. The lack of data can lead to poor decision making and a subsequent increase in risk until the lagging indicators show increases in injury rates.
In this case, workers will be unknowingly at risk and the company will be less likely to keep their frontline safe. In contrast, using leading indicators provides enough data points to ensure continued low incident rates.
For example, a company that was studied in research conducted by Carnegie Mellon University, lowered its total incidents by 95.3% between 2009 and 2010. As a result of this reduction in incidents, the company was only left with 20 lagging indicator data points to analyze in an effort to reduce future incidents. Fortunately, the company had 8,215 leading indicator data points in 2010.
As they experienced fewer incidents, lagging data was no longer sufficient in providing relevant and continuous learning opportunities.
Safety Projects International Inc. studies and academic papers have addressed the need to adopt leading indicators. However, the best way to understand this need is to start by looking at a practical example to understand the tangible benefits gained from their use.
Consider the following scenario:
A storage warehouse requires workers to wear steel toe boots before handling heavy crates. It’s a standard safe work practice (SWP) the employer has put in place and the assumption is that everyone follows it. However, assumptions can be very different than reality, so how often are they actually following the SWP? This is where leading indicators come into play.
Regular observations can capture and record this information (i.e., number of observations with/without steel toe boots) and then corrective actions (i.e., additional safety training, reminders of safety expectations), and if necessary disciplinary action can be introduced before someone gets injured.
Another way leading indicators can help your company is by providing insight into why unsafe behaviors occur. Using the same example, if the company was also to record the nature of the task at hand (i.e., extensive preparation before handling the crates like labeling and categorizing), the result could reveal why workers are not following proper procedures.
Using these measures, the storage warehouse might find that non-compliance with this procedure is a result of the workers’ perceived ‘need for speed’ in completing a task. Knowing that, the storage warehouse would be able to address worker perception (leading indicator) to improve compliance and avoid potential incidents. Furthermore, leading indicators can also be used to benchmark current practices and demonstrate continuous improvement over time.
For example, recording the time taken to complete corrective actions (start date to completion date) and comparing it to other sites/locations can identify which sites/locations are communicating and executing on change most effectively.
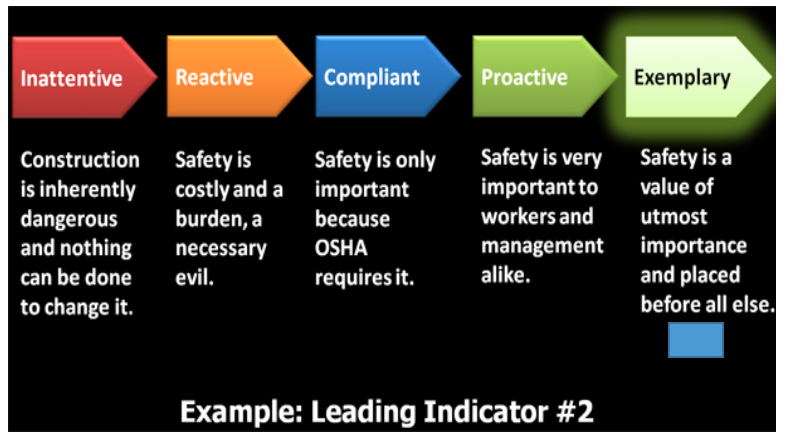
Addressing such a deficiency and reducing the time taken to complete corrective actions can show management’s commitment to moving from being merely compliant with safety procedures to participating in best practice activities that.keep employees safe.
Limitations of Leading Indicators
By measuring the inputs to a process, leading performance indicators can actually complement the use of lagging indicators and compensate for some of their shortcomings. Of course, despite being the ‘holy grail’ of safety, failing to implement them properly will expose their own limitations.
These failures include:
1 Failing to be guided by the learnings of the leading metrics and using them only to pad a scoreboard.
For example, concentrating on leading indicators like participation rate of workers in toolbox talks to get strong results on paper (instead of putting efforts towards engaging workers in these discussions), can limit the benefit of the metric and not drive the right behaviours.
2 Selecting leading indicators that are not in line with the level of sophistication of the company’s safety program.
If a company’s safety department is just beginning to implement new programs, focused mostly on compliance, using leading indicators like time to complete corrective actions, may be too advanced to yield practical results.
At this beginning stage, workers need to understand the importance of following a protocol, so using employee perception surveys to understand who does and does not buy-in to the changing compliance rules, will help identify your champion employees and your employees that need more education.
3 targeting the wrong issues through a lack of understanding of the contributing factors that affect indicator performance
For instance, if hand injuries are occurring, it would be reasonable to monitor the use of required PPE as a leading performance indicator. However, if back injuries are occurring frequently, clearly monitoring the use of gloves as an indicator will not add value. Ensure that the indicator monitored is relevant to your employees.
4 Creating incentives that can be “manipulated” to improve outcomes of the indicator itself rather than its intended purpose.
“The moment there are financial consequences attached to performance with respect to an indicator there is an incentive to manage the indicator itself rather than the phenomenon of which it is supposed to provide an indication” (Hopkins 2007: 13). Leading indicators are popularly known to contribute well to incentive schemes when monitored carefully. However, if the initiatives are in place simply to get a good score of the leading indicator, rather than to improve processes and guide actions, they may result in a poorer safety culture.
Workers may tend to manipulate the numbers by over-stating deficiencies, in order to cash out on incentives. Therefore, it is important to attach incentives to the process instead of the outcome.
There are strong business incentives to seek improved safety performance since safety has increasingly become a competitive differentiator. However, it is rare to find a company that is able to sustain continuous improvement and not run into a performance plateau.
Companies that successfully sustain continuous improvement start by shifting their focus from lagging to leading indicators.
According to Safety Projects International Inc., while 89% of its company’s clients viewed leading indicators as extremely or very important, 61% of companies had an imbalance in favor of lagging indicators, and 69% of companies had difficulty identifying corrective or preventative actions from leading indicators.
The results of their study show that companies understand the importance of leading indicators at a high level but seem to have difficulty implementing and maintaining them.
The next section, choosing the Right Leading Indicators, will provide further insight into how your company can successfully select leading indicators prior to implementing them across your EHS department.
Unlike lagging indicators, which tend to be standard across industries and sectors (albeit sometimes calculated differently, but that’s a topic for another day), for leading indicators to be effective, they must be designed to match your company’s safety culture.
The leading indicators you should use depend primarily on the maturity of your safety program and the goals or desired outcomes you would like to achieve.
In this section, we have designed a test to help you determine your maturity level. We’ve also provided guidelines on how to set goals and created a list of leading indicator suggestions that can improve your probability of success.
The success of your leading indicator project is heavily dependent on the maturity level of your company. The more mature your safety program is, the more in-depth and sophisticated your leading indicators are.
We’ve designed a quick review to help determine your company’s maturity level. For the sake of simplicity, we’ve divided the maturity level into three stages: beginner, intermediate and advanced.
After determining your company’s maturity level, the next step is to set goals for tracking leading indicators. Like other corporate departments, it’s important to develop both long-term and short-term goals aligned with your maturity level.
For example, if the maturity of your safety program is at a beginner level, your long-term goal may be to focus on getting your safety program up to compliance to qualify for work in your industry.
If your maturity level is intermediate, then your program is most likely already in compliance with the minimum requirements to qualify for work in your sector and industry.
Your long-term goal may be to work on complying with new safety management standards such as: OHSAS 18001, ISO 45001, VPP or COR. Compliance with these standards makes you a leader in your industry and may provide your company with a competitive advantage.
Finally, if your maturity level is advanced, then you have probably gone beyond meeting both the minimum and the industry standard health and safety requirements. Your goal, then, may be to lead your industry by developing your own health and safety management program, driven by continuous improvement.
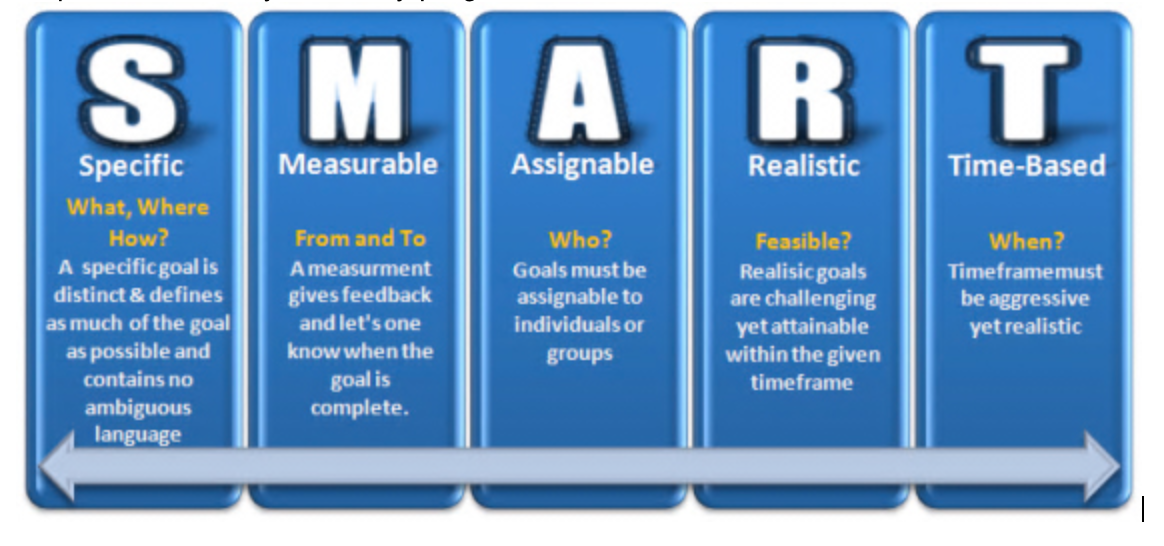
Now that you’ve determined your long-term goal, it’s time to work on smaller scale, SMART goals for leading indicators. SMART goal setting ensures each goal is (S) pecific, (M) easurable, (A) chievable, (R) elevant and (T) ime-bound. These SMART goals will be crucial in effectively measuring the results of your individual leading indicators and determining the success of your entire initiative.
There are a couple strategies you can use to determine your SMART goals which we will cover below. It’s important, when creating short-term goals, to ensure they align with the executive goals of your company. Not only will this help you gain executive buy-in, but the data that SMART goals generate will help prove the corporate value of your safety program.
Here are a couple methods you can employ to help set your SMART goals:
1 Look for holes in your existing management system.
A great way to set goals for your leading indicators initiative is to investigate the holes in your existing program.
For instance, if you noticed that many of your employees are lacking the proper training they need, your goal for the year could be to implement a 12-month safety training program and measure attendance and competence.
2 Analyze your lagging indicators against industry averages.
Another way to set leading indicator goals is to analyze lagging indicators for improvement opportunities.
For example, if you’ve noticed that you’re OSHA recordable injury rate is slightly above your industry standard, then your goal for the first year could be to reduce the OSHA recordable incident rate to the industry standard and most importantly, continue to lower the rate for each of the next five years.
Now that you have determined your maturity level and set your goals, the next step is to choose which leading indicators to track.
If this is your first time tracking leading indicators, then it might be best to start with tracking 2 to 4 metrics.
Then, as your program matures and your employees get more comfortable with the new process, you can try introducing more metrics.
To help you with this process, we’ve created a “kitchen sink list” of leading indicators for each maturity level and included it in the appendix of this guide. This laundry list of leading indicators is to give you guidelines and suggestions based on what our customers and other leaders in the industry are using.
How to Choose the Right Leading Indicators for Your Company
If you are at the beginner maturity level and trying to meet the minimum requirements for safety compliance to qualify for work in your industry, new employee training might be a hole in your safety program. As such, your goal would be to get all new hires completely up to date on their safety training.
The leading indicator you could use to help meet that goal would be to track the% of new hires trained. It’s simple, all you need is:
- The number of new employees in a period,
- The number of training certificates required,
- The number of training certificates completed.
This data can usually be tracked using Microsoft, Excel, or if your company has more than 50 employees, you may consider the numerous software options.
Keep in mind that leading indicators can be a trial-and-error process. You might think that a particular leading indicator may be useful in theory, but in practice, it may fail to provide the information you need. That’s why it is important to think long and hard about the leading indicators that you use.
Here are a couple more things to consider when choosing the right leading indicators for your company:
3 Do not let lagging indicator reporting keep you from trying leading indicators.
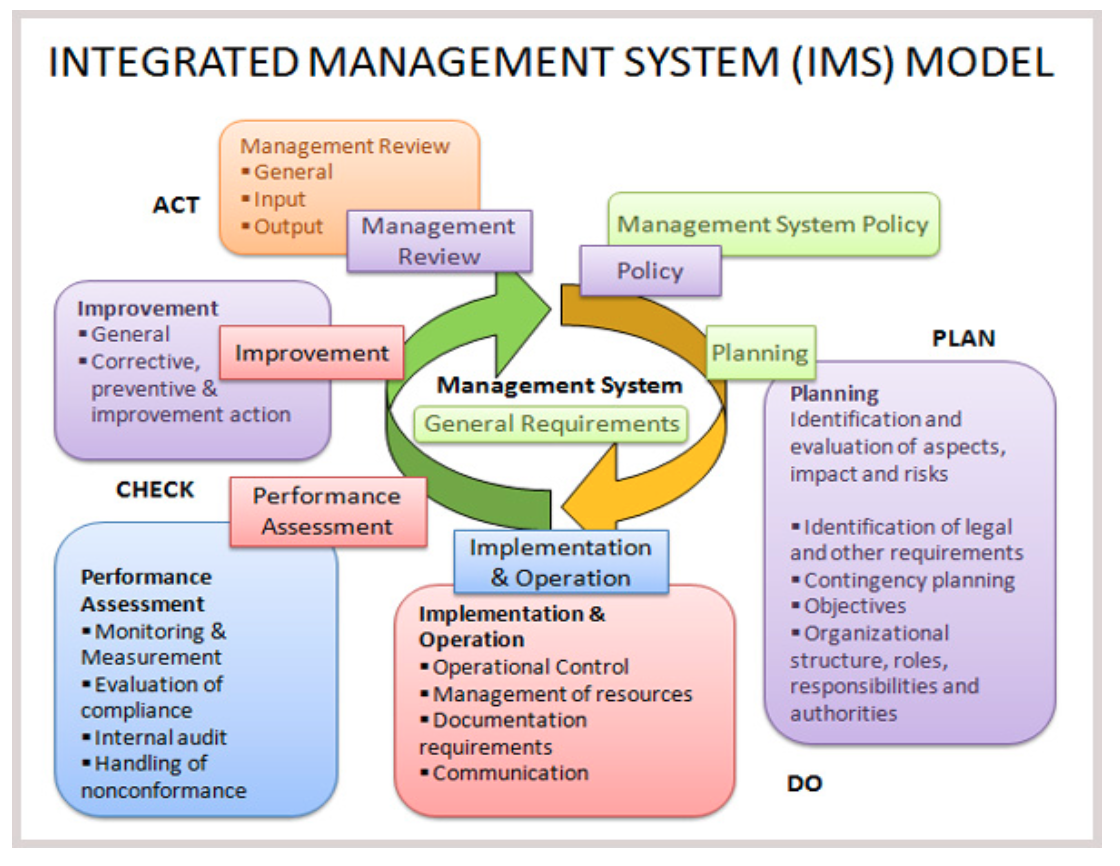
Experiment with leading indicators and measure a few new KPl’s under the radar to figure out what makes sense for your company. Leading indicators can often be behavior based, with new measures including ‘activity’ or ‘results’ based metrics in the Plan-Do-Check-Act Cycle. Figuring out the true velocity of your Plan-Do-Check-Act cycle will help you identify chokepoints in your process or areas of weakness in your program, team or culture.
4 constantly refresh your leading and lagging KPl’s.
Once you have experienced success improving one particular metric, replace it with a metric where you feel there’s significant room for improvement.
In our company, we started measuring over 16 KPl’s, whittled it down to 12, and then ultimately 7 that work best for us today. Looking back, half of the 7 were never even used 24 months ago. Continuous improvement does not sleep. Do not rest on your laurels!
Introducing new initiatives can be tricky. ~any people are resistant to change and afraid of the unknown. However, tracking leading indicators will only result in improvements in your safety program if employees throughout your company participate in either collecting the data, analyzing it or executing changes.
Tracking leading indicators is not a one-person process. It requires multiple people to cooperate, participate and engage.
Here are four tips for successful change management:
1 A Compelling Story
As mentioned above, one of the reasons why people are extremely reluctant to change is the fear of the unknown. Change is a movement into unchartered territory, where the comfort of learned repetitive activities is replaced with the anxiety of new conditions.
In order to reduce this paralyzing anxiety, try explaining the real, uninhibited reasons behind the change. In other words, explain how tracking leading indicators will help improve your safety program and eliminate hazards before they become incidents, not after.
If employees trust that the decision to change has been made for the right, logical reasons, they will trust that the decision was made by taking into account the pending unchartered territory.
2 Role Modeling
Ever heard the phrase: “lead by example”? If you want your workers to track leading indicators, then you must demonstrate through your actions, attitude, and activism that the new way is the not just the right way, but the only sure two-way communication exists and remains ongoing throughout the leading indicator initiative.
Acknowledge that you have received the leading indicator data and let your employees know that you are acting on it. Employees are influenced by fearless leadership, and leaders need to recognize that paying lip-service to change management activities yields sub-par results while real actions drive positive outcomes.
3 Reinforcing Mechanisms
One of the most difficult areas for management is finding the right mix of creativity and process. Too much process, as most of us have experienced, can yield bureaucratic results, while too little process ill-prepares management and employees for surprising, unfamiliar situations. In order to successfully implement the changes needed for tracking leading indicators, the process is required because of the repetitive nature of the desired result.
Employees across the company need to know exactly what process to go through if a hazard is present, reducing ambiguity and providing reinforcement of a successful result. Also, acknowledge or celebrate those who first embrace the process.
By acknowledging their success, you will encourage those who are slower to adapt to get onboard as well.
4 Capability Building – Skill, Will and Attitude
That’s the mantra we use when hiring at Safety Projects International Inc. We only hire people who possess all three but that doesn’t mean we can’t all improve further. Change management requires people to have enough skill to implement the initiative and that the company has the appropriate tools to encourage success. Managers and employees need to be trained in the new leading indicator metrics, how to track them and what to expect when doing so. Training reduces the friction that inhibits success and will provide you with a substantial ROI.
Change management is only the first step in operationalizing a leading indicators initiative at your workplace. Now, you need to actually start tracking them. This section is designed to help you operationalize tracking your leading indicators.
Here are some tips and best practices to heIp you get started:
1 Set Target Performance Levels
Target performance levels should be used as a benchmark against your actual results. For example, if you have started tracking the number of safety meetings, set targets for the number you expect to have in a given period. If you surpass your target, management can be notified of the progress and will be interested in the next goal that you set.
Another thing to consider when setting your target performance levels is the relationship between your leading indicator metrics and throughput.
If the company’s throughput has doubled, any analysis of leading indicators is likely to reflect the increase in work activities. Ensure you are understanding your corporate trends when setting your target performance levels.
2 Collect Data
For effective execution of safety initiatives, it is imperative that you collect data on the underlying activities that make up your leading indicators. This data should always be integrated with the overall safety management system.
Tracking leading indicators, whether it be through the use of paper forms and excel spreadsheets or a completely integrated cloud and mobile software solution, should be a crucial and unwavering part of your routine safety activities.
While basic database and word processing might be effective for small companies, with more than 50 employees, a company should invest in software that helps your safety team collect, analyze and share data while providing for two-way transparency and engagement between management and employees.
Frontline workers need the opportunity to seamlessly communicate hazards or other risks to management and management needs the ability to react in real time to correct problems that may lead to an incident. Without these capabilities, your company is taking on a significant amount of risk and operating at a disadvantage.
3 Analyze the Data
In order for leading indicators to be effective, once the data is collected, it must also be analyzed by management. Go through your data regularly. Check how your actual results are compared against your performance levels. Keep an eye out for any outliers or potential hazards that need to be addressed.
Look for any trends, either positive or negative, and respond appropriately. The leading indicator data is only as useful as your ability to analyze and make changes based on it. If you find that tracking a particular leading indicator isn’t effective or isn’t providing the useful information you were hoping for, then change the metric.
4 Make Proactive Changes
After you have analyzed your data, you have to act and make changes in order for leading indicators to be effective. If you notice that the number of actual toolbox talks is lower than your performance target, talk to your site supervisors about why meetings are being missed or not recorded. The real underlying reason is more important than the paper forms themselves.
If you notice that corrective actions are taking too long to close, talk to your onsite workers and supervisors about the issue and make sure you have the proper procedures in place for responding to corrective actions in a timely manner. Making changes is a crucial part of the Plan-Do-Check-Act continuous improvement cycle that leading indicator support.
If you want to see drastic improvements in your safety program and a drop in your lagging indicators (such as time loss or injury rates), you need to successfully act on the information you receive from leading indicators.
Additional Things to Consider:
While metrics are especially great for management, they don’t necessarily tell the whole story. It’s important not to forget the story behind these numbers and to include a story when sharing results across the company.
Use KPl’s and numbers to highlight themes and contextualize real life stories that you can use to paint tangible pictures for both executives and frontline personnel. Numbers, alone, can often “lose people” to the core message and actions you are inspiring.
Remember, leading indicators can be a trial-and-error process. The expectation is not to get it right in one shot. Your safety program should strive to continuously improve. As such, sometimes it’s best to experiment with leading indicators before incorporating them into your formal KPI reporting for executives. If you are unsure if a leading indicator will be effective or not, try tracking it for a couple months as an experiment without formally reporting it up the chain.
If it proves to be useful, you can always start incorporating it into your KPI reporting for executives.
If not, you can always revise the leading indicator until you find ones that are most effective for your company.
Getting the right information from leading indicators is only the first step in attaining safety excellence. Companies must follow up on the intelligence obtained from these indicators and understand what truly impacts the success and failure of their company’s safety program.
Before assessing the success of a safety program, it is imperative to determine how the company defines success of an EHS initiative. As we have seen previously, a company’s EHS maturity level will strongly influence the safety goals that are chosen.
Achieving these goals will determine the success of the safety program at that point in time. Therefore, it is vital for a company to first determine the maturity level and their goals, before a concrete definition of success can be established.
The next natural question to ask is how do leading indicators contribute to the success of these goals and to the safety program as a whole? Once a company has clearly defined its desired safety goals, it needs to choose the right leading indicators that can best contribute towards achieving them.
To determine the impact of these leading indicators on the goals, the company requires an action plan. The fundamental steps in developing such an action plan include:
A) Collecting the baseline (historical) data for the safety performance if available.
B) Using the baseline data to establish SMART targets for each leading indicator
C) Comparing the actual performance against these SMART targets will establish the success of the leading indicators.
One way to determine the success of leading indicators is to observe the inverse relationship they have with lagging indicators. If you see an improvement in leading indicators, lagging indicator results are likely to decline (figure below).
Together, leading and lagging indicators provide a solid, bigger-picture perspective on what is and is not working is your OHS management program.
The following examples will help you better understand how companies may measure the success of leading indicators:
1 Set Target Performance Levels
Another Safety Projects International Inc. study found that over 45% of safety professionals believe more than10% of recordable incidents could have been prevented in the past year if employees were more engaged in safety programs. If a high level of employee engagement should be the goal for the company, then success will be defined as attaining this target.
Engaged employees not only feel a greater sense of loyalty and commitment to the company and perform at higher levels, but they are also enthusiastic and motivated to help achieve the company goals.
Companies with a high level of engagement report, on average, 22% higher productivity, according to a new meta-analysis of 1.4 million employees conducted by the Gallup Company.
These are desirable outcomes for any company, but how can leading indicators help us achieve this? According to the action plan outlined above, the first step is finding the baseline of the relevant leading indicators, answering questions like the ones below can help measure the current state of worker engagement:
1) How many employees are showing up to the pre-job safety meetings/toolbox talks?
2) Are the workers contributing to the discussions and giving their responses?
3) Are the employees involved in the safety decision-making processes?
4) Are the employees being provided with meaningful safety training after their orientation?
The next step is to set a SMART target for each of the measures based on historical data. For example, if all employees currently do not have complete training, it is essential for the company to actively address this deficiency and ensure employees are equipped with the knowledge they need to do their jobs safely.
Once these deficiencies are addressed, data on progress needs to be collected over a sufficient period and compared to the original targets to determine the success of the leading indicator. Based on this example, the target was to ensure that every employee had received the most recent training.
Looking at how many employees have successfully received this training will be a measure of the success of the leading indicator as well as its contribution to the goal.
A leading indicator may be the percentage of trained workers. Over time we see evidence (lagging indicators) that more trained workers translate into fewer incidents/ less harm. In response, the organization provides more training.
2 Speed of completing corrective action items.
Well-designed corrective action programs are essential for any company dedicated to learning and improvement. Unless a company actively manages actions to correct its problems and implement improvement opportunities, it will quite likely suffer needless recurrences of safety incidents. A company may set reducing the time taken to implement corrective actions as a goal for the safety department. Based on the action plan above, they will first need to analyze the baseline, which in this case is the time currently being taken for corrective actions and use it to set a SMART target. Tracking the time taken for the corrective action to be passed on from one party to another can be an example of the leading indicator used for attaining the goal.
3 Quality and speed of communication in the company
Getting all employees on the same page can be challenging. Every company needs to create a concise communication plan that delivers clear messaging around its desired safety culture. A fast and efficient feedback loop serves to inform, confirm, and reinforce the value of the company’s commitment.
If improving communication within the safety department is a top priority and goal for the company, then it is important to interact with workers as much as possible.
Committing to meet workers twice a day to provide updates both in the morning and at night is one example of improving communication, transparency and creating the opportunity to receive employee feedback.
Collecting historical and current data on the speed of quality communication like the number of workers actively participating and engaging in such meetings can pave the way for setting SMART targets.
If these targets are met within a specified time frame, the leading indicator will have been successful and, consequently, it will have positively contributed to the EHS goal
4 Continuous risk reduction
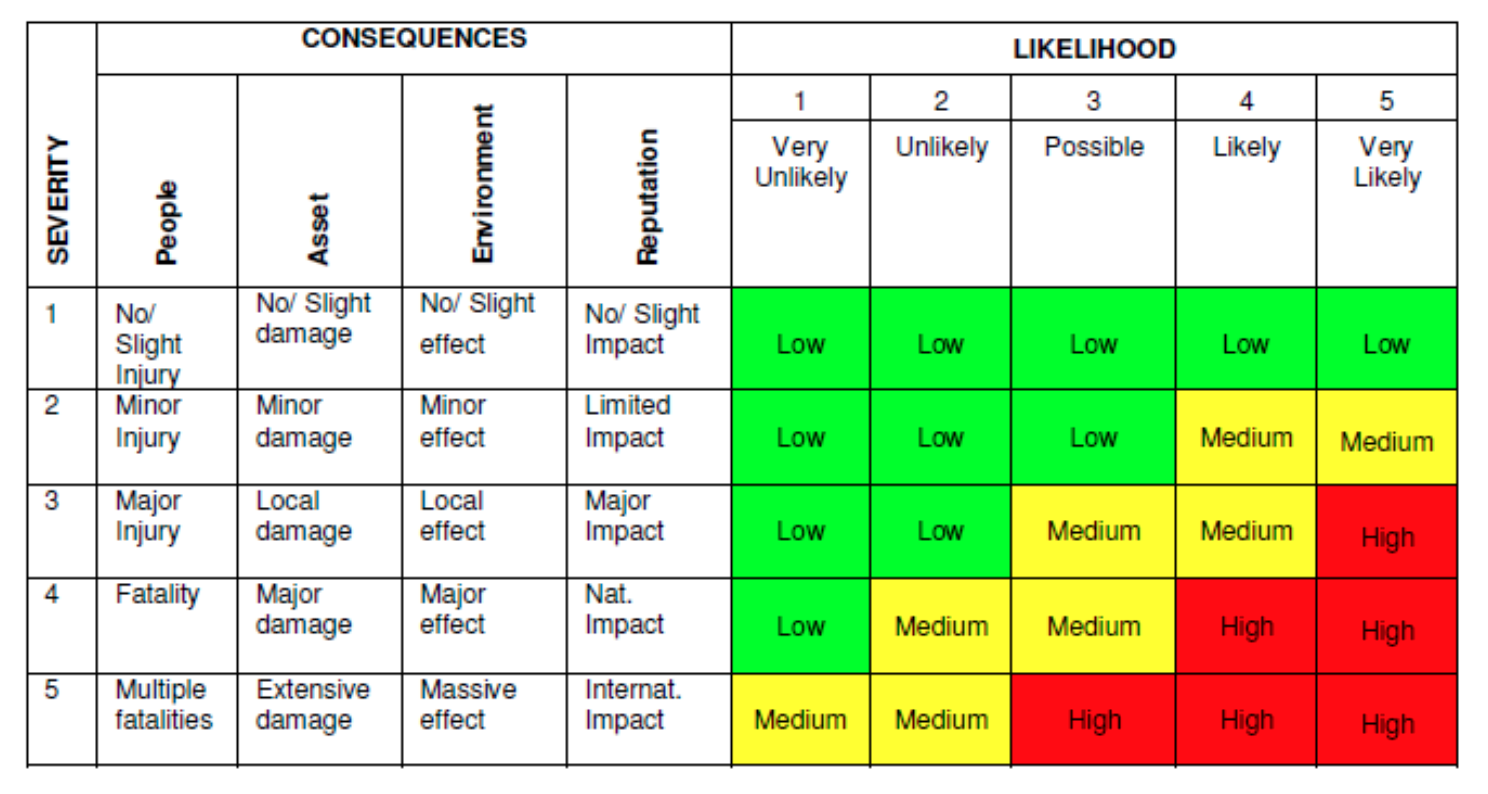
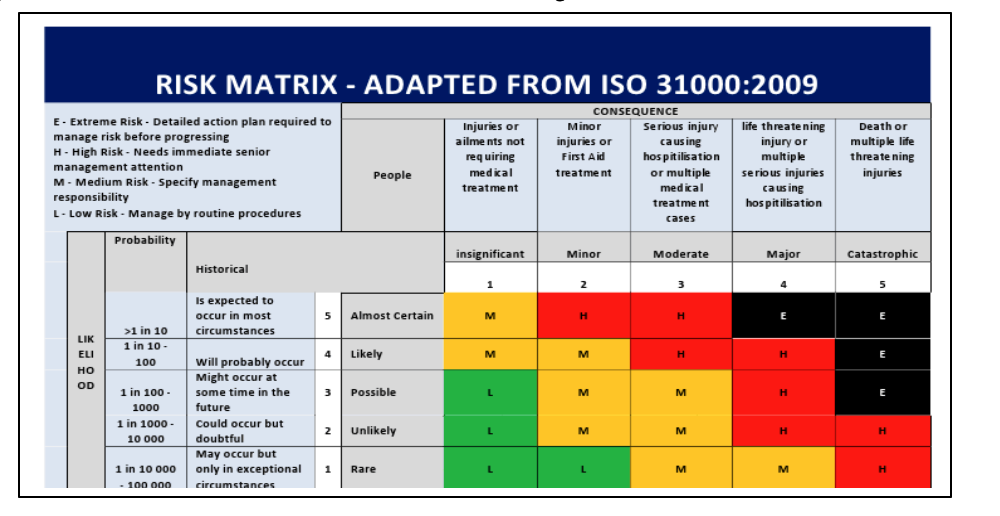
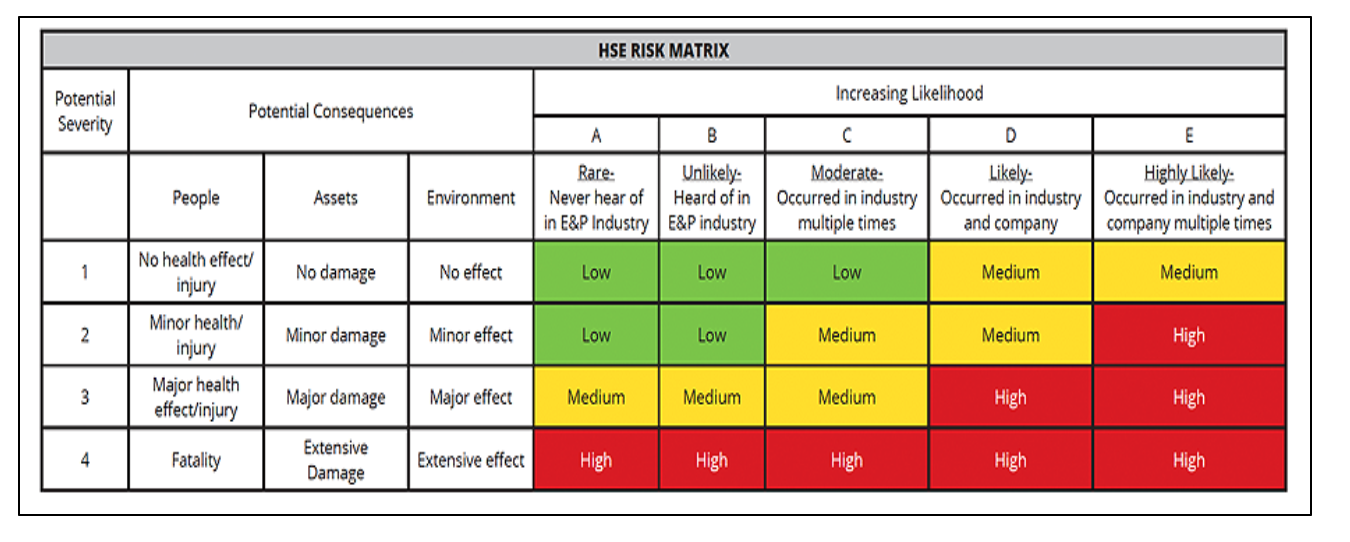
The hazards resulting from the range of activities undertaken by an organization will vary in likelihood, severity, and exposure. The range, nature, distribution, and significance of the hazards will determine the risks that need to be controlled.
Mitigating safety risks is key-everything from slips, trips, falls, and injuries from moving heavy objects to vehicle collisions, explosions, fires, and chemical exposures. Risk assessment and mitigation is one of the most important elements of a strong safety program.
Therefore, companies may set risk assessments as a primary goal. The power of hazard analysis is to identify the risks of undesirable scenarios that could lead to losses and negatively impact the effectiveness of a safety program.
Determining the baseline for hazard analysis can help identify the SMART target for the company. Comparing leading indicators, like the number of completed hazard assessments to its set target, will establish how successful the indicator has been in reducing risk for the company and in achieving its goal.
Adopting technology and safety software that clearly links hazards to tasks and incorporates easy to use hazard assessments, can greatly improve a company’s ability to reduce risk and the time taken to achieve targets without adding extra administrative work.
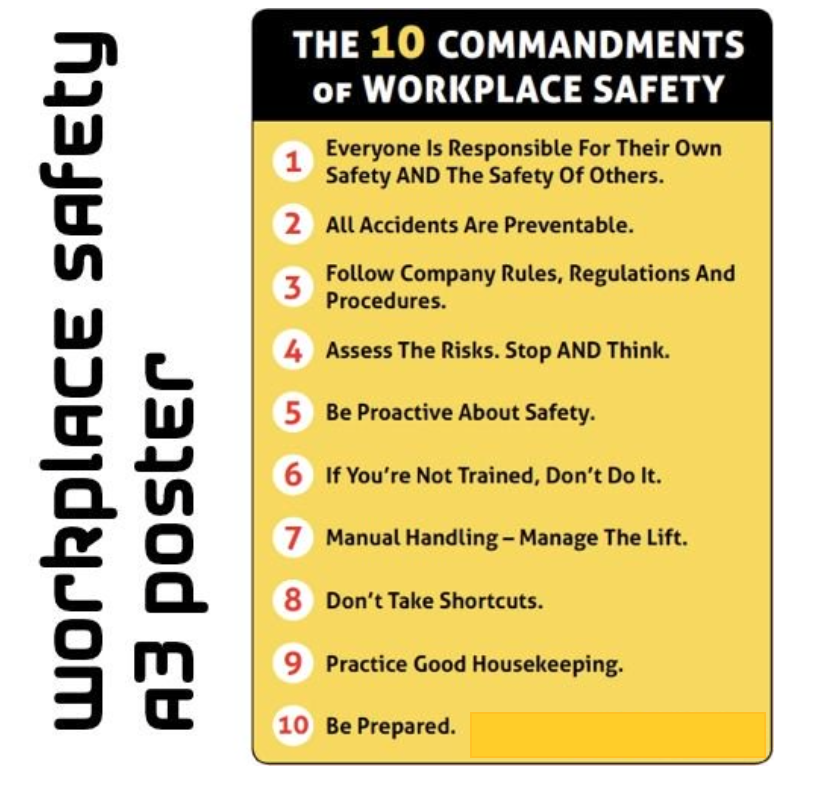
Studies show 90% of all workplace injuries are based on attitude, behaviour and culture.” A true safety culture develops when employees are motivated to perform their tasks in the safest way.
Safety culture is difficult to measure, which means that identifying a goal is both challenging and extremely necessary. Safety slogans are great, but creating a winning safety culture requires resources. Improvements need to be made. Problems need to be solved. If funding a safety project is a constant battle, you may have one of two issues: either management doesn’t value safety improvements, or you can’t provide a measurable ROI. A well-organized safety culture rewards employees for proactive behaviour and places an emphasis on preventative safety.
Measuring current and historical levels of the safety culture through leading indicators, like responses in an anonymous survey or outcomes of an incentive program, can unravel current worker sentiments. Establishing SMART goals based on this historical information and comparing it to the actual results of newly defined or previously improved leading indicators will determine your success. Measuring health and safety performance is a continuous process. But, like any other activity, measurements should be both efficient and effective, so the frequency with which it takes place can be planned appropriately.
Having set concrete, measurable goals, tracking their performance, and knowing exactly what success looks like would make gauging the success of the safety program and the leading indicators very easy.
It is vital to continuously improve from one stage of EHS performance to the next.
Ask yourself questions such as:
- A) Does your organization have safety goals, which align and focus your colleagues to a common goal? Is it the right goal?
- B) What do you have to do differently in the next 24 months to make a “step change” in safety performance?
- C) How do you measure what you need to know to make the best management decisions over the next 24 months?
Leading indicators will evolve if we think we have gotten them “right”. We need to clearly understand the concept of maturity, goals, and success of leading indicators for the EHS efforts to positively affect all areas of business performance.
” The single biggest mistake organizations make is to have too few performance measures. The second biggest is to have too many.
In order to continue to grow your company and improve its safety performance, it is imperative for companies to start reducing their focus on failure-focused measures (lagging indicators) and draw their attention to continuous improvement leading indicator metrics.
Implementing leading indicators in a company is not an overnight task. It takes time, patience, analysis and understanding to ensure you are setting your safety department up for success.
From the initial sections of this document, you were able to understand why leading indicators are important, the limitations that exist and what level or stage your company is currently in.
Taking the information at face value will help you understand the importance of leading indicators, but it won’t let you realize the benefits of implementing them.
In the latter part of the guide, we walked you through a proposed implementation process that prepares you for change management. Change in any company can attract a level of reluctance from employees no matter how big or small it may be.
As a safety leader or professional that is spearheading the success of the department, it is imperative to not only implement the change, but also communicate its effectiveness and benefits to those around you. After having read through the document, we hope to have communicated that there will be a fair share of experimenting when implementing leading indicators. There isn’t a “one size fits all” policy when dealing with safety for a company.
What works for one company may not work for another and what doesn’t work for your competitor may work for you. You should keep an open mind and let yourself run a trial-and-error process when beginning implementation.
Reference this document as a helpful resource for your planning and execution and as always, if you are invested in utilizing the benefits of technology to help you execute your Safety goals.
To meet the minimum requirements for safety compliance to qualify for work within your industry/region.
Safety meetings completed inspections completed hazard assessments employees trained training hours (per employee, per site, per time frame) non-conformances on site/ operations non-conformances with policies or procedures near miss reports OHS legislation addressed by procedures i.e.) level of compliance to standard.
To bring your safety management system up to an industry standard and improve your relative safety performance within the industry.
Proactive risk or hazard identifications recorded; Positive safety acknowledgements given to team (aka safety opportunities) people trained in hazard identification.
Training gaps (courses or certificates) outstanding at period end across workforce training hours (per employee, per site, per time frame) Safety procedure/policy documents read across entire company unsafe observations recorded by trained personnel.
Risks by specific category (e.g., fall protection, confined space, housekeeping, etc.) corrective/ preventative actions recorded Corrective/ preventive actions relative to staff count.
New assessments for changes in processes or equipment
Incidents with a root cause that includes lack of training and frequency of audits performed near miss reports staff read acknowledgments for roles and responsibilities completed toolbox talks (planned vs actual) risk assessments completed per schedule/plan.
To become a safety leader in your industry by defining your own safety management system driven by high velocity continuous improvement.
Safety meetings attended by non-safety personnel, safety procedure/policy documents read by non-safety personnel staff read acknowledgements for roles and responsibilities completed toolbox talks, planned vs actual proactive safety opportunities recorded recognitions for safe behavior repeat findings assessments to evaluate potential severity unsafe observations reported per employee per time period gaps in the hazard, identification process incidents with a root cause related to inadequate risk assessment assessments deemed unacceptable to EHS manager (i.e. sent back for re-submission) corrective actions prioritized by risk (e.g. high severity, low severity, life-threatening, etc.)
Facilities experiencing X % turnover comparisons with predictive measures to performance outcomes predictive measures meeting performance outcomes how frequent OHS briefings/meetings occur participation rate for safety meetings ratio of unsafe to safe observations Average# of days to completion on corrective/preventative action residual risk score change vs last period correlation rate between your top leading and top lagging indicators staff who believe safety is a priority for management job/ risk assessment tasks completed corrective/ preventative actions overdue vs. on schedule preventive and corrective actions communicated to staff ratio of corrective actions according to hazard type (e.g. confined space, fall protection, etc.) predictive measures meeting performance outcomes.