I deally, in every design of every component, the stress–strength relationship looks like this figure. The stress is well below the strength.
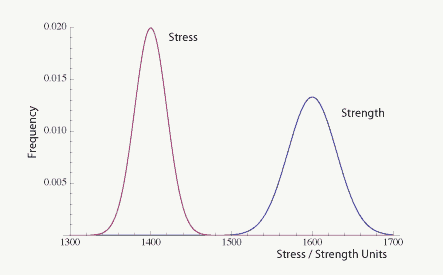
This implies there is very little chance of failure due to the element being overstressed.
Also, ideally, we fully characterize all stresses and all strengths for each element of a product. This is generally difficult to accomplish and it is rarely done to that extent.
In practice, we narrow down the list of critical parts and then perform the stress — strength calculations.
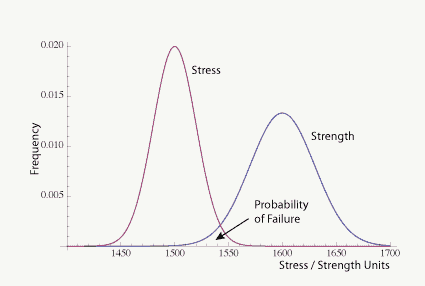
There are occasions where there is a definite possibility that some of the elements will experience the chance of stresses that are higher than that element’s ability to survive. It is this intersection between the two curves that provides the probability of failure.
To calculate that area is to define the double integral that solves for the probability of the stress being higher than the strength. Think of a small normal curve under the overlapping curves.
NOTE: I did not shade in the area under both curves which would overstate the probability of failure. As noted by careful readers, in the case when both stress and strength are normally distributed (be sure to verify that is true) the probability of failure is itself a normal curve. I was not able to draw a good enough looking small normal curve and will try to sort it out so it’s clear.
Application
In practice the stress curve and the strength curves are unknown. In many cases with a little work, we can gather sufficient data to plot two histograms and visually check for the margin.
A little more work using statistical tools allows an estimate of the probability the strength is applied to an item with low strength.
We typically use tools like engineering judgment, Design FMEA, HALT and prototype failures to isolate which elements may require detailed stress/strength analysis.
The concept applies when making design decisions even without sufficient data to plot the two curves.
Design or derating guidelines and best practices allow the team to create sufficient design margin with the initial design.
Over Time
Things change. Material degrades, creeps, or become brittle. Metals rust, contacts corrode, PN junctions blur boundaries, and more. Overtime the product that started working perfectly eventually fails.
The strength curve may simply shift towards the stress curve. Or it may widen the spread of the curve. Either way, it increases the probability given the same stress curve that a failure will occur.
And the stress curve is not static. Customers continue to find harsher and more demanding environments to use a product.
Summary
When I was first introduced to this concept, it just made sense. And I suspect, it does to any engineer.
The idea that we can create components with exactly known capabilities and fully characterize the applied stress thought the product lifetime is folly.
One approach is creating products with plenty of margin (distance between the stress and strength curves). In critical applications or when working to reduce the chance of failures, we gather the data and plot the curves. Even do the calculations of probability of failure.
A little engineering statistics is good fun.