 There is an expression that “no two snowflakes are alike.” Similarly quality characteristics of parts produced from the same production process are not alike.
A simple production process, e.g., turning, can have variations in the machined diameter of a shaft because of play in the tooling or operators skill. These variations lead to “quality risks,” i.e., if variations in the process are not controlled there is a risk of producing out-of-specification machined shafts.
By managing the process, the risk of production of defective products can be minimized. Statistical Process Control (SPC) provides a scientific way of measuring, analyzing and controlling variations in processes. It eliminates the element of quality risk by developing a predictable and consistent process.
There are several statistical techniques available for controlling process variations and improving process capability. One such technique is known as control chart. A control chart is a statistical tool that detects unusual causes of variations in a process to minimize the risk of producing defective parts.
There are two types of control charts:
| Types | Uses |
| Variable chart | Used when variable data is available such as diameter etc. |
| Attribute chart | Used with the attribute data such as conforming/nonconforming products etc. |
There are many types of variable control charts. The most commonly used variable control chart is the X bar & R Chart.
- The X bar chart is a plot of a sample average. It shows the variations between subgroups and the location of the process average for a chosen quality characteristic
- The R chart is a plot of ranges. It shows the variation within a subgroup and is a measure of variability in the process.
Both X bar & R Chart consists of:
- Center line
- Upper control limit,
- Lower control limit.
Some basic steps to plot an X-bar and R-Chart are given below:
1. X-bar chart:
- Determine the quality characteristic (e.g., shaft diameter) to be charted.
- Select a subgroup size, subgroup frequency and number of subgroups.
- Record the diameter for each sample.
- Calculate the average (X bar) diameter for each subgroup.
- Plot the X bar points.
- Connect the consecutive X bar points with a line.
- Calculate the X double bar (average of X bars’).
- Draw a solid line for the X double bar.
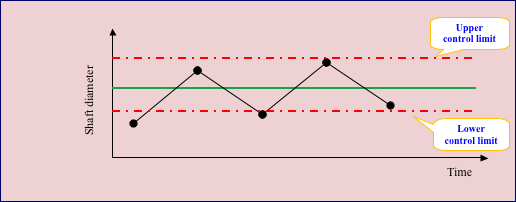
- Calculate control limits for the X bar chart.
- Draw dashed lines for the UCL and LCL.

FIGURE 1: X-BAR CHART
2. R-bar chart
- Calculate the Range (R) for each subgroup.
- Plot the R values.
- Connect consecutive R points with a line.
- Calculate the R bar (average of R values).
- Draw a solid line for R (bar).
- Calculate the control limits for the R chart.
- Draw dashed lines for the UCL and LCL.
Once the center lines and control limits are calculated and plotted on the chart, continue to take samples from the production process and plot it on the chart. Apply tests to the X bar and R chart, to determine if special causes are acting on the process. If that is the case, find out and eliminate the root causes to make the process stable and free of special causes.
In conclusion, no two things are alike. Same way, no two parts produced from same production processes at the same time are alike. This is due to variations in the process. These variations make the process unstable and therefore quality of parts cannot be predicted. SPC eliminate the element of this quality risk by making the process stable and predictable. Control chart is one of the SPC tools that provide a systematic method to detect and eliminate special causes of variations to make the process stable and predictable. Once the process is in statistical control (stable and predictable), its performance to meet the specification can be assessed.
Bio:
Afaq has extensive experience in developing and implementing holistic management systems with the sole objective of driving organization wide excellence. He holds a MS degree in Mechanical Engineering. He is a senior member of American Society for Quality (ASQ). He holds certifications as ASQ Certified Organizational Excellence/ Quality Manager, Quality Engineer and Quality Auditor. He is a Certified RABQSA International Skill Examiner and Quality Management System Lead Auditor.