Stress–Strength Concept
 Ideally, in every design of every component the stress–strength relationship looks like this figure:
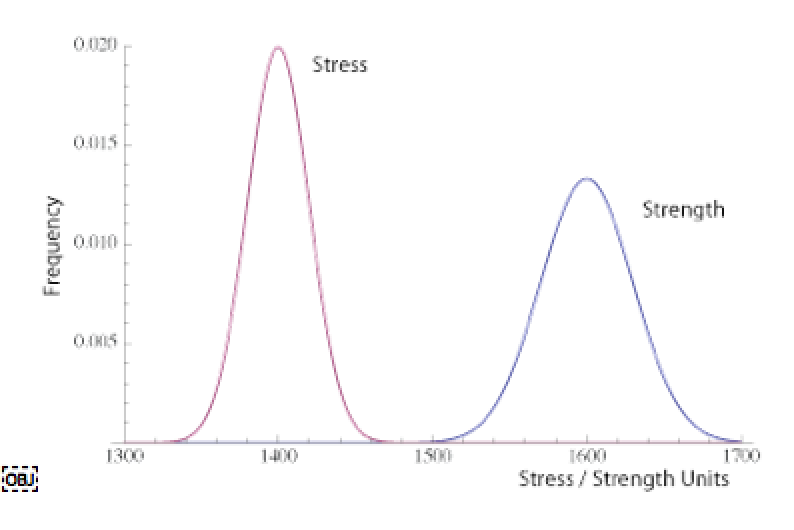 You will notice that the stress is well below the strength. This implies there is very little chance of failure as a result of the element being overstressed. Also, ideally, we fully characterize all stresses and all strengths for each element of a product. This is generally difficult to accomplish and it is rarely done to that extent.
In practice we could narrow down the list of critical parts and then perform the stress–strength calculations.
There are occasions when there is a definite possibility that some of the elements will experience the chance of stresses that are higher than that element’s ability to survive. It is this intersection between the two curves that provides the probability of failure. Calculating that area involves defining the double integral that solves for the probability of the stress being higher than the strength. Think of a small normal curve under the overlapping curves.
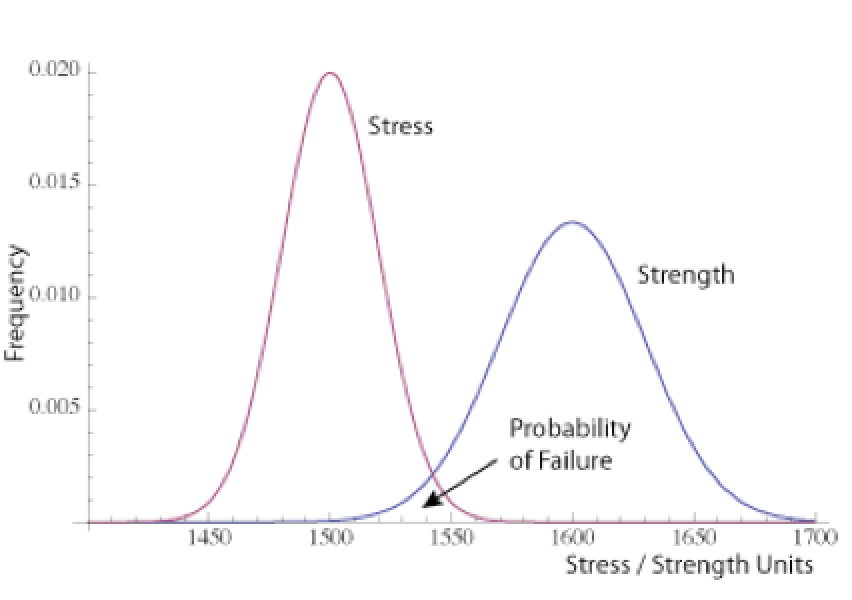 Note that in the figure the area under both curves has not been shaded. That would overstate the probability of failure. As noted by careful readers, in the case when both stress and strength are normally distributed (be sure to verify that this is true) the probability of failure is itself a normal curve that would reside within the region labeled “Probability of Failure.”
Application
In practice, the stress curve and the strength curves are unknown. In many cases with a little work we can gather sufficient data to plot two histograms and visually check for the margin. A little more work using statistical tools allows us to estimate the probability that the strength is applied to an item with low strength.
We typically use tools such as design FMEA and HALT along with prototype failures and engineering judgment to isolate which elements may require detailed stress–strength analysis.
The stress–strength concept applies when making design decisions even without sufficient data to plot the two curves. Design or derating guidelines and best practices enable the team to create sufficient design margin with the initial design.
Impact of Time
Things change. Material degrades, creeps, or becomes brittle. Metals rust, contacts corrode, PN junctions blur boundaries, etc. Over time the product that started working perfectly eventually fails. In such cases, the strength curve may simply shift toward the stress curve, or it may widen the spread of the curve. In either case it increases the probability given the same stress curve that a failure will occur.
In addition, the stress curve is not static. Customers continue to find harsher and more demanding environments to use a product. So the stress curve might start moving toward the strength curve too.
Final Thoughts
When I was first introduced to this concept, it just made sense, as I suspect it does to any engineer. The idea that we can create components with exactly known capabilities and fully characterize the applied stress throughout the product lifetime is folly.
One approach is to create products with plenty of margin (distance between the stress and strength curves). In critical applications or when working to reduce the chance of failures, we gather the data and plot the curves. It is even worth calculating the probability of failure. A little engineering statistics can be good fun.
Bio:
Fred Schenkelberg is an experienced reliability engineering and management consultant with his firm FMS Reliability. His passion is working with teams to create cost-effective reliability programs that solve problems, create durable and reliable products, increase customer satisfaction, and reduce warranty costs. If you enjoyed this articles consider subscribing to the ongoing series at Accendo Reliability.